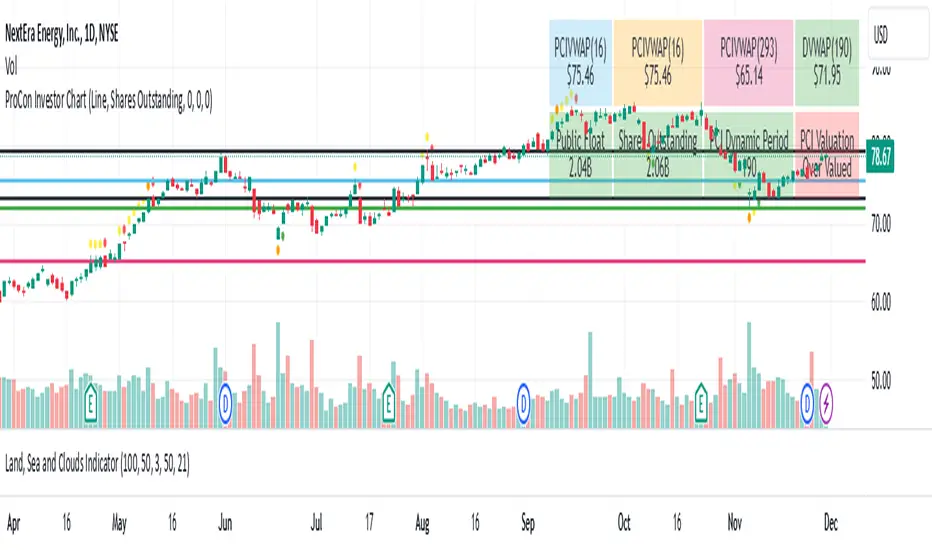
ProCon Investor Chart

The ProCon Investor Chart is a unique integration of multiple technical indicators designed to provide actionable insights for traders. Unlike standalone indicators such as RSI, Stochastic, or Bollinger Bands, this script combines them into a proprietary framework that evaluates market conditions holistically.
Each component is enhanced to complement the others:
- Dots: Proprietary algorithms combine RSI, Stochastic, MACD, and Bollinger Bands to determine overbought/oversold conditions and high-volume reversals. This combination adds a unique dimension by accounting for both momentum and market participation.
- VWAP-Based Support and Resistance: The VWAP lines are calculated dynamically by combining trade volume with shares outstanding or public float, making them adaptable to specific securities and timeframes. This approach provides more precise levels compared to static support/resistance calculations.
- Colored Bars: SMA-based trend analysis identifies short- and long-term trends while ensuring transparency for trend traders. The inclusion of SMA (5, 20, 50) allows users to spot transitions and key moments of trend reversal.
By integrating these components, the ProCon Investor Chart helps traders identify opportunities that standalone indicators might miss, providing a comprehensive view of market behavior.
Indicator Description and How to Use
The ProCon Investor Chart is a multi-layered analytical tool designed for identifying trends, market sentiment, and dynamic support/resistance levels. Here's how it works:
Dots for Overbought/Oversold Conditions:
Calculated using RSI, Stochastic, MACD, and Bollinger Bands.
- Yellow dots (above/below bars) signify overbought/oversold levels.
- Orange dots highlight high-volume oversold/overbought areas, combining price action and market participation.
- Red and green dots mark potential reversals in price trends.
VWAP Support and Resistance Lines:
VWAP lines are calculated using a proprietary metric that integrates trade volume with public float or shares outstanding.
These levels adapt dynamically and are reset based on trading activity, offering precise support/resistance points.
Trend-Driven Colored Bars:
Bars are color-coded based on SMA values (5, 20, 50) to identify trends and market transitions.
Table Summary:
Displays VWAP levels, sentiment analysis, and dynamic metrics, offering traders a snapshot of critical data.
This approach ensures that the script provides unique insights beyond what individual indicators can achieve. By integrating multiple dimensions of technical analysis, the ProCon Investor Chart is a reliable companion for day traders, swing traders, and investors seeking actionable market analytics.
Value Proposition for Invite-Only Script
While the ProCon Investor Chart uses classic indicators like RSI, Bollinger Bands, and VWAP, it integrates these elements into a proprietary system that offers unique advantages:
Advanced Calculations:
The VWAP-based support and resistance levels go beyond standard VWAP by integrating trade volume with float data, making them highly adaptable to specific securities.
Actionable Visuals:
The dot-based system simplifies the detection of overbought/oversold levels, incorporating volume and momentum into one visual cue.
Trend-Specific Features:
By combining SMAs with custom color coding, the script allows trend traders to identify transitions at a glance.
Additional Features
Table Display: Support and resistance lines are conveniently displayed in a table in the top-right corner of the chart, along with a simple valuation of the stock relative to these levels.
This multi-dimensional approach justifies the script’s originality and ensures that users receive actionable insights tailored to their trading strategies.
The ProCon Investor Chart is designed to consolidate multiple data points into a unified tool, helping traders make informed decisions with greater confidence. Its custom dynamic VWAP calculations and sentiment analysis provide a clear and actionable view of market conditions.
Script su invito
Solo gli utenti autorizzati dall'autore hanno accesso a questo script e ciò richiede solitamente un pagamento. Puoi aggiungere lo script ai tuoi preferiti, ma potrai utilizzarlo solo dopo aver richiesto l'autorizzazione e averla ottenuta dal suo autore - per saperne di più leggi qui. Per maggiori dettagli, segui le istruzioni dell'autore qui sotto o contatta direttamente ProConInvestor.
TradingView NON consiglia di pagare o utilizzare uno script a meno che non ci si fidi pienamente del suo autore e non si comprenda il suo funzionamento. Puoi anche trovare alternative gratuite e open-source nei nostri script della comunità.
Istruzioni dell'autore
Attenzione: prima di richiedere l'accesso, leggi la nostra guida per gli script su invito.
Declinazione di responsabilità
Script su invito
Solo gli utenti autorizzati dall'autore hanno accesso a questo script e ciò richiede solitamente un pagamento. Puoi aggiungere lo script ai tuoi preferiti, ma potrai utilizzarlo solo dopo aver richiesto l'autorizzazione e averla ottenuta dal suo autore - per saperne di più leggi qui. Per maggiori dettagli, segui le istruzioni dell'autore qui sotto o contatta direttamente ProConInvestor.
TradingView NON consiglia di pagare o utilizzare uno script a meno che non ci si fidi pienamente del suo autore e non si comprenda il suo funzionamento. Puoi anche trovare alternative gratuite e open-source nei nostri script della comunità.
Istruzioni dell'autore
Attenzione: prima di richiedere l'accesso, leggi la nostra guida per gli script su invito.