PROTECTED SOURCE SCRIPT
Momentum Phases
📌 Overview
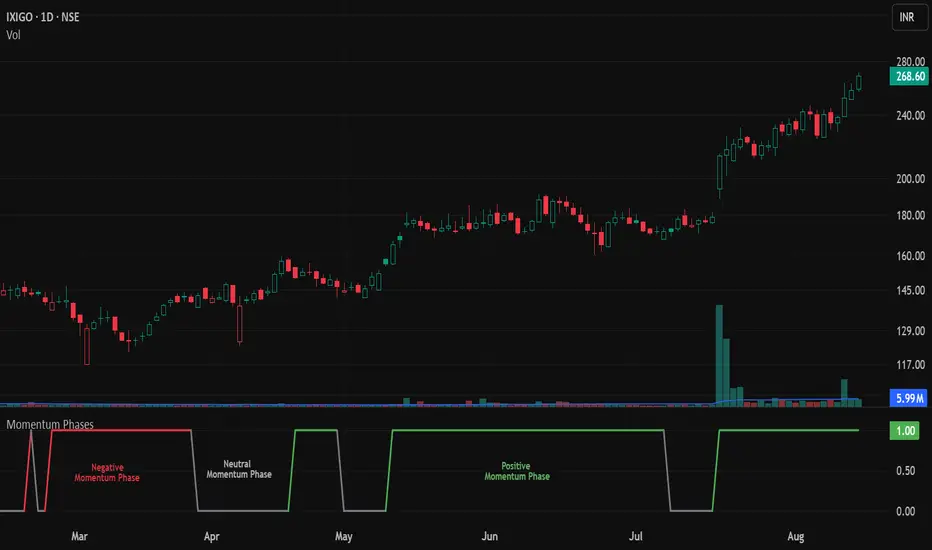
The Momentum Phases indicator helps traders quickly identify periods of strong bullish or bearish momentum based on the relationship between a short‑term and a long‑term Moving Average (SMA).
It helps traders visually distinguish between Positive 🟢, Negative 🔴, and Neutral ⚪ phases by plotting a dynamically colored state line and generating optional alerts when a phase change occurs.
🧠 How It Works
⦿ SMA Calculation
Pine Script®
⦿ Momentum Ratio
Pine Script®
⦿ Threshold Levels
⦿ Momentum States
⦿ State Line Plot
📈 How to Use
⚙️ Customization
🔔 Alerts
🎯 Add this indicator to your chart to track momentum phases like a pro — know exactly when trends start, end, or stall.
The Momentum Phases indicator helps traders quickly identify periods of strong bullish or bearish momentum based on the relationship between a short‑term and a long‑term Moving Average (SMA).
It helps traders visually distinguish between Positive 🟢, Negative 🔴, and Neutral ⚪ phases by plotting a dynamically colored state line and generating optional alerts when a phase change occurs.
🧠 How It Works
⦿ SMA Calculation
- The indicator calculates two SMAs:
- Short SMA (default: 7 periods)
- Long SMA (default: 65 periods)
- Both SMA lengths can be adjusted by the user.
// SMA calculations
smaShort = ta.sma(close, shortLen)
smaLong = ta.sma(close, longLen)
⦿ Momentum Ratio
- A ratio is calculated:
ratio = smaShort / smaLong
- This ratio measures how far the short‑term trend has diverged from the long‑term trend.
⦿ Threshold Levels
- Positive Threshold (default: 1.05) — indicates short SMA is at least 5% above the long SMA.
- Negative Threshold (default: 0.95) — indicates short SMA is at least 5% below the long SMA.
- These thresholds are user‑adjustable.
⦿ Momentum States
- Positive Momentum: Ratio ≥ Positive Threshold (default: 1.05) → Short SMA is at least 5% above Long SMA.
- Negative Momentum: Ratio ≤ Negative Threshold (default: 0.95) → Short SMA is at least 5% below Long SMA.
- Neutral: Ratio between the two thresholds.
⦿ State Line Plot
- The indicator plots a flat state line at 1.0 when in positive or negative momentum, and 0.0 when in neutral.
- The state line’s color changes dynamically:
- Green 🟢 Positive Momentum: Ratio ≥ Positive Threshold (default: 1.05) – Short SMA is at least 5% above Long SMA.
- Red 🔴 Negative Momentum: Ratio ≤ Negative Threshold (default: 0.95) – Short SMA is at least 5% below Long SMA.
- Gray ⚪ Neutral: Ratio between the two thresholds.
📈 How to Use
- Trend Confirmation: Use the state line color to quickly confirm the prevailing momentum.
- Green 🟢: Consider focusing on long setups
- Red 🔴: Consider focusing on short setups
- Gray ⚪: Consider staying neutral or waiting for stronger signals
- Trade Filtering: Filter trades in your existing strategy so they only align with the detected momentum phase.
- Early Warnings: Enable phase change alerts to get notified when market conditions shift.
⚙️ Customization
- SMA Periods: Adjust short and long SMA lengths to suit your trading timeframe.
- Thresholds: Tighten (closer to 1.00) for more frequent signals, or widen for fewer but stronger signals.
🔔 Alerts
- 🟢 Positive Momentum START – Stock/Security shifts into positive momentum.
- ⚪ Positive Momentum END – Positive momentum ends (neutral state).
- 🔴 Negative Momentum START – Market shifts into negative momentum.
- ⚪ Negative Momentum END – Negative momentum ends (neutral state).
- Momentum Phase Change – Any shift between Positive, Negative, or Neutral.
🎯 Add this indicator to your chart to track momentum phases like a pro — know exactly when trends start, end, or stall.
Script protetto
Questo script è pubblicato come codice protetto. Tuttavia, è possibile utilizzarle liberamente e senza alcuna limitazione – ulteriori informazioni qui.
Naved Iqbal
Declinazione di responsabilità
Le informazioni e le pubblicazioni non sono intese come, e non costituiscono, consulenza o raccomandazioni finanziarie, di investimento, di trading o di altro tipo fornite o approvate da TradingView. Per ulteriori informazioni, consultare i Termini di utilizzo.