OPEN-SOURCE SCRIPT
MACD Divergence all in one
MACD Divergence all in one
It can also be named as MACD dual divergence detector pro !
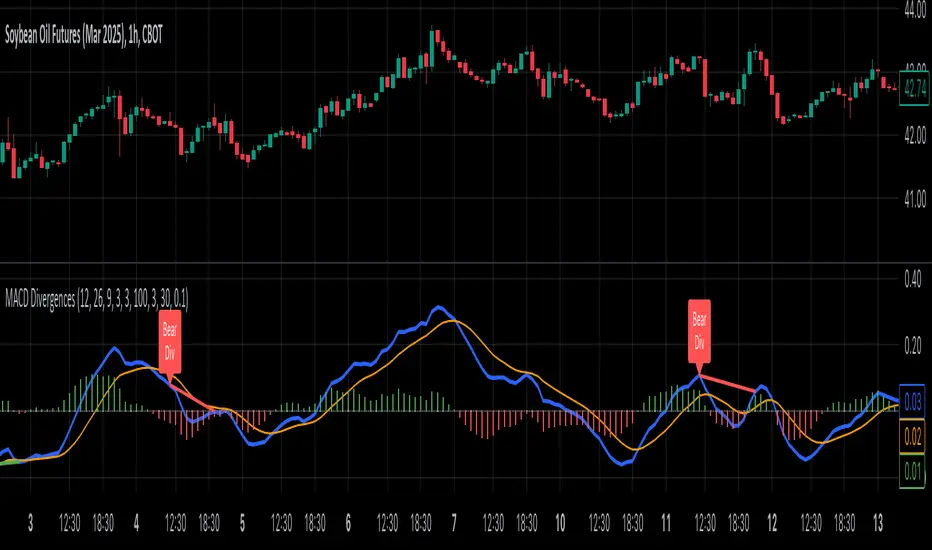
A sophisticated yet user-friendly tool designed to identify both bullish and bearish divergences using the MACD (Moving Average Convergence Divergence) indicator. This advanced script helps traders spot potential trend reversals by detecting hidden momentum shifts in the market, offering a comprehensive solution for divergence trading.
🎯 Key Features:
• Automatic detection of bullish and bearish divergences
• Clear visual signals with color-coded lines (Green for bullish, Red for bearish)
• Smart filtering system to eliminate false signals
• Customizable parameters to match your trading style
• Clean, uncluttered chart presentation
• Optimized performance for real-time analysis
• Easy-to-read labels showing divergence types
• Built-in signal spacing to avoid clustering
📊 How it works:
The indicator uses an advanced algorithm to analyze the relationship between price action and MACD momentum to identify:
Bullish Divergences:
- Price makes higher lows while MACD shows lower lows
- Signals potential trend reversal from bearish to bullish
- Marked with green lines and upward labels
Bearish Divergences:
- Price makes lower highs while MACD shows higher highs
- Signals potential trend reversal from bullish to bearish
- Marked with red lines and downward labels
⚙️ Customizable Settings:
1. MACD Parameters:
- Fast Length (default: 12)
- Slow Length (default: 26)
- Signal Length (default: 9)
2. Divergence Detection:
- Left/Right Pivot Bars
- Divergence Lookback Period
- Minimum/Maximum Divergence Length
- Divergence Strength Filter
3. Visual Settings:
- Clear color coding for easy identification
- Adjustable line thickness
- Customizable label size
💡 Best Practices:
- Most effective on higher timeframes (1H, 4H, Daily)
- Combine with support/resistance levels
- Use with trend lines and price action
- Consider volume confirmation
- Best results during trending markets
- Use appropriate stop-loss levels
🎓 Trading Tips:
1. Look for bullish divergences near support levels
2. Watch for bearish divergences near resistance zones
3. Confirm signals with other technical indicators
4. Consider market context and overall trend
5. Use proper position sizing and risk management
⚠️ Important Notes:
- Past performance doesn't guarantee future results
- Always use proper risk management
- Test settings on historical data first
- Different timeframes may require parameter adjustments
- Not all divergences lead to reversals
Created by: Anmol-max-star
Last Updated: 2025-02-25 16:15:08 UTC
📌 Regular updates and improvements planned!
Disclaimer:
This indicator is for informational purposes only. Always conduct your own analysis and use proper risk management techniques. Trading involves risk of loss, and past performance does not guarantee future results.
🤝 Support:
Feel free to leave comments for:
- Suggestions
- Improvements
- Feature requests
- Bug reports
- General feedback
Your feedback helps make this tool better for everyone!
Happy Trading and May the Trends Be With You! 📈
It can also be named as MACD dual divergence detector pro !
A sophisticated yet user-friendly tool designed to identify both bullish and bearish divergences using the MACD (Moving Average Convergence Divergence) indicator. This advanced script helps traders spot potential trend reversals by detecting hidden momentum shifts in the market, offering a comprehensive solution for divergence trading.
🎯 Key Features:
• Automatic detection of bullish and bearish divergences
• Clear visual signals with color-coded lines (Green for bullish, Red for bearish)
• Smart filtering system to eliminate false signals
• Customizable parameters to match your trading style
• Clean, uncluttered chart presentation
• Optimized performance for real-time analysis
• Easy-to-read labels showing divergence types
• Built-in signal spacing to avoid clustering
📊 How it works:
The indicator uses an advanced algorithm to analyze the relationship between price action and MACD momentum to identify:
Bullish Divergences:
- Price makes higher lows while MACD shows lower lows
- Signals potential trend reversal from bearish to bullish
- Marked with green lines and upward labels
Bearish Divergences:
- Price makes lower highs while MACD shows higher highs
- Signals potential trend reversal from bullish to bearish
- Marked with red lines and downward labels
⚙️ Customizable Settings:
1. MACD Parameters:
- Fast Length (default: 12)
- Slow Length (default: 26)
- Signal Length (default: 9)
2. Divergence Detection:
- Left/Right Pivot Bars
- Divergence Lookback Period
- Minimum/Maximum Divergence Length
- Divergence Strength Filter
3. Visual Settings:
- Clear color coding for easy identification
- Adjustable line thickness
- Customizable label size
💡 Best Practices:
- Most effective on higher timeframes (1H, 4H, Daily)
- Combine with support/resistance levels
- Use with trend lines and price action
- Consider volume confirmation
- Best results during trending markets
- Use appropriate stop-loss levels
🎓 Trading Tips:
1. Look for bullish divergences near support levels
2. Watch for bearish divergences near resistance zones
3. Confirm signals with other technical indicators
4. Consider market context and overall trend
5. Use proper position sizing and risk management
⚠️ Important Notes:
- Past performance doesn't guarantee future results
- Always use proper risk management
- Test settings on historical data first
- Different timeframes may require parameter adjustments
- Not all divergences lead to reversals
Created by: Anmol-max-star
Last Updated: 2025-02-25 16:15:08 UTC
📌 Regular updates and improvements planned!
Disclaimer:
This indicator is for informational purposes only. Always conduct your own analysis and use proper risk management techniques. Trading involves risk of loss, and past performance does not guarantee future results.
🤝 Support:
Feel free to leave comments for:
- Suggestions
- Improvements
- Feature requests
- Bug reports
- General feedback
Your feedback helps make this tool better for everyone!
Happy Trading and May the Trends Be With You! 📈
Script open-source
Nello spirito di TradingView, l'autore di questo script lo ha reso open source, in modo che i trader possano esaminarne e verificarne la funzionalità. Complimenti all'autore! Sebbene sia possibile utilizzarlo gratuitamente, ricordiamo che la ripubblicazione del codice è soggetta al nostro Regolamento.
Declinazione di responsabilità
Le informazioni e le pubblicazioni non sono intese come, e non costituiscono, consulenza o raccomandazioni finanziarie, di investimento, di trading o di altro tipo fornite o approvate da TradingView. Per ulteriori informazioni, consultare i Termini di utilizzo.