OPEN-SOURCE SCRIPT
Standard Deviation Bands
Standard Deviation Bands
คำอธิบายอินดิเคเตอร์:
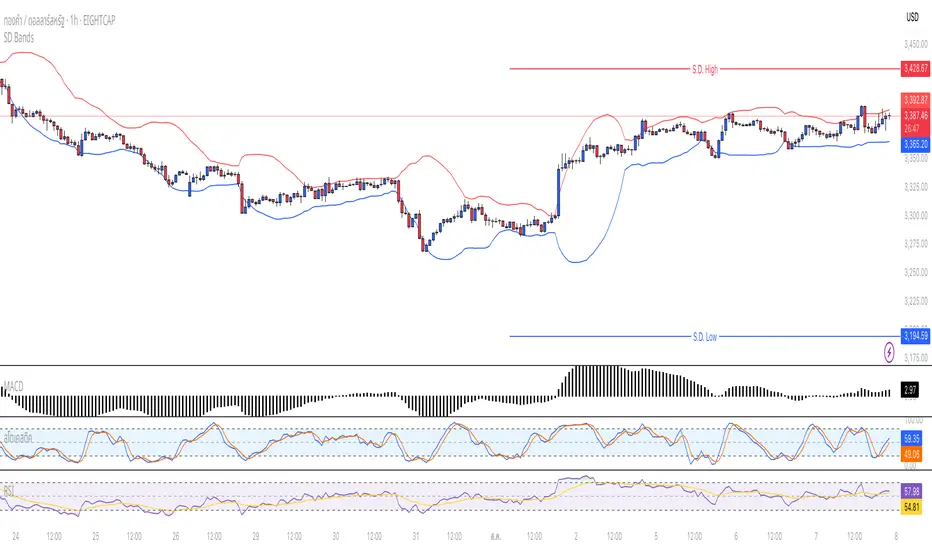
อินดิเคเตอร์ SD Bands (Standard Deviation Bands) เป็นเครื่องมือวิเคราะห์ทางเทคนิคที่ออกแบบมาเพื่อวัดความผันผวนของราคาและระบุโอกาสในการเทรดที่อาจเกิดขึ้น อินดิเคเตอร์นี้จะแสดงผลเป็นเส้นขอบ 2 เส้นบนกราฟราคาโดยตรง โดยอ้างอิงจากค่าเฉลี่ยเคลื่อนที่ (Moving Average) และค่าส่วนเบี่ยงเบนมาตรฐาน (Standard Deviation)
* เส้นบน (Upper Band): แสดงระดับที่ราคาเคลื่อนไหวสูงกว่าค่าเฉลี่ย
* เส้นล่าง (Lower Band): แสดงระดับที่ราคาเคลื่อนไหวต่ำกว่าค่าเฉลี่ย
ความกว้างของช่องระหว่างเส้นทั้งสองบ่งบอกถึงระดับความผันผวนของตลาดในปัจจุบัน
วิธีการใช้งานอย่างละเอียด:
คุณสามารถนำอินดิเคเตอร์ SD Bands ไปประยุกต์ใช้ได้หลายวิธีเพื่อประกอบการตัดสินใจ ดังนี้:
1. การใช้เป็นแนวรับ-แนวต้านแบบไดนามิก (Dynamic Support & Resistance)
* แนวรับ: เมื่อราคาวิ่งลงมาแตะหรือเข้าใกล้เส้นล่าง (เส้นสีน้ำเงิน) เส้นนี้อาจทำหน้าที่เป็นแนวรับชั่วคราวและมีโอกาสที่ราคาจะเด้งกลับขึ้นไปหาเส้นกลาง
* แนวต้าน: เมื่อราคาวิ่งขึ้นไปแตะหรือเข้าใกล้เส้นบน (เส้นสีแดง) เส้นนี้อาจทำหน้าที่เป็นแนวต้านชั่วคราวและมีโอกาสที่ราคาจะย่อตัวลงมา
2. การวัดความผันผวนและสัญญาณ Breakout
* ช่วงตลาดสงบ (Low Volatility): เมื่อเส้น SD ทั้งสองเส้นบีบตัวเข้าหากันเป็นช่องที่แคบมาก (คล้ายกับ Bollinger Squeeze) แสดงว่าตลาดมีความผันผวนต่ำมาก ซึ่งมักจะเป็นสัญญาณว่ากำลังจะเกิดการเคลื่อนไหวครั้งใหญ่ (Breakout)
* ช่วงตลาดเป็นเทรนด์ (High Volatility): เมื่อเส้น SD ขยายตัวกว้างออกอย่างรวดเร็ว พร้อมกับที่ราคาวิ่งอยู่นอกขอบ แสดงว่าตลาดเข้าสู่ช่วงเทรนด์ที่แข็งแกร่งและมีโมเมนตัมสูง
3. สัญญาณการกลับตัว (Reversal Signals)
* เมื่อราคาปิดแท่งเทียน นอกเส้น SD Bands อย่างชัดเจน (โดยเฉพาะหลังจากที่เทรนด์นั้นดำเนินมานาน) อาจเป็นสัญญาณว่าแรงซื้อ/แรงขายเริ่มอ่อนกำลังลง และมีโอกาสที่จะเกิดการกลับตัวของราคาในไม่ช้า
การตั้งค่าอินพุต (Input Parameters):
* ระยะเวลา (Length): กำหนดจำนวนแท่งเทียนที่ใช้ในการคำนวณค่าเฉลี่ยและ SD
* 20: สำหรับการวิเคราะห์ระยะสั้นถึงกลาง
* 50 หรือ 100: สำหรับการวิเคราะห์ระยะยาว
* ตัวคูณ (Multiplier): กำหนดระยะห่างของเส้น SD จากค่าเฉลี่ย
* 1.0 - 2.0: เส้นจะอยู่ใกล้ราคามากขึ้น ทำให้เกิดสัญญาณบ่อยขึ้น
* 2.0 - 3.0: เส้นจะอยู่ห่างจากราคามากขึ้น ทำให้เกิดสัญญาณที่น่าเชื่อถือมากขึ้น แต่จะเกิดไม่บ่อย
ข้อควรระวังและคำเตือน:
* อินดิเคเตอร์นี้เป็นเพียง เครื่องมือวิเคราะห์ เพื่อช่วยในการตัดสินใจ ไม่ใช่สัญญาณการซื้อขายที่ถูกต้อง 100%
* ควรใช้ร่วมกับเครื่องมืออื่นๆ เช่น RSI, MACD, หรือ Volume เพื่อยืนยันสัญญาณ
* การเทรดมีความเสี่ยงสูง ควรบริหารจัดการความเสี่ยงและตั้งจุด Stop Loss ทุกครั้ง
คุณสามารถใช้โครงสร้างนี้ในการเขียนโพสต์บน TradingView ได้เลยนะครับ ขอให้ประสบความสำเร็จกับการโพสต์อินดิเคเตอร์ของคุณครับ!
English
Standard Deviation Bands
Indicator Description:
The SD Bands (Standard Deviation Bands) indicator is a powerful technical analysis tool designed to measure price volatility and identify potential trading opportunities. The indicator displays two dynamic bands directly on the price chart, based on a moving average and a customizable standard deviation multiplier.
* Upper Band: Indicates price levels above the moving average.
* Lower Band: Indicates price levels below the moving average.
The width of the channel between these two bands provides a clear picture of current market volatility.
Detailed User Guide:
You can use SD Bands in several ways to enhance your trading decisions:
1. Dynamic Support and Resistance:
These bands can act as dynamic support and resistance levels.
* Support: When the price moves down and touches or approaches the lower band, it can act as support, offering the possibility of a rebound to the average.
* Resistance: When the price moves up and touches or approaches the upper band, it can act as resistance, offering the possibility of a rebound.
2. Volatility Measurement and Breakout Signals:
* Low Volatility (Squeeze): When the two bands converge and form a narrow channel. Indicates very low market volatility. This condition often occurs before significant price movements or breakouts.
* High Volatility (Expansion): When the bands expand and widen rapidly, it indicates that the market is entering a period of strong trending momentum with high momentum.
3. Reversal Signals:
* When the price closes significantly outside the SD Bands (especially after a long-term trend), it may signal that the current momentum has expired and a reversal may be imminent.
Input Parameters:
The indicator's parameters are fully customizable to suit your trading style:
* Length: Defines the number of bars used to calculate the moving average and standard deviation.
* 20: Suitable for short- to medium-term analysis.
* 50 or 100: Suitable for long-term trend analysis.
* Multiplier: Adjusts the sensitivity of the signal bars.
* 1.0 - 2.0: Creates narrower signal bars, leading to more frequent signals.
* 2.0 - 3.0: Creates wider signal bars, providing fewer but potentially more significant signals.
Important Warning:
* This indicator is an analytical tool only. It does not provide guaranteed buy or sell signals.
* Always use it in conjunction with other indicators (such as RSI, MACD, and Volume) for confirmation.
* Trading involves high risk. Proper risk management, including the use of stop-loss orders, is recommended.
You can use this structure for your posts on TradingView. Good luck with your indicators!
คำอธิบายอินดิเคเตอร์:
อินดิเคเตอร์ SD Bands (Standard Deviation Bands) เป็นเครื่องมือวิเคราะห์ทางเทคนิคที่ออกแบบมาเพื่อวัดความผันผวนของราคาและระบุโอกาสในการเทรดที่อาจเกิดขึ้น อินดิเคเตอร์นี้จะแสดงผลเป็นเส้นขอบ 2 เส้นบนกราฟราคาโดยตรง โดยอ้างอิงจากค่าเฉลี่ยเคลื่อนที่ (Moving Average) และค่าส่วนเบี่ยงเบนมาตรฐาน (Standard Deviation)
* เส้นบน (Upper Band): แสดงระดับที่ราคาเคลื่อนไหวสูงกว่าค่าเฉลี่ย
* เส้นล่าง (Lower Band): แสดงระดับที่ราคาเคลื่อนไหวต่ำกว่าค่าเฉลี่ย
ความกว้างของช่องระหว่างเส้นทั้งสองบ่งบอกถึงระดับความผันผวนของตลาดในปัจจุบัน
วิธีการใช้งานอย่างละเอียด:
คุณสามารถนำอินดิเคเตอร์ SD Bands ไปประยุกต์ใช้ได้หลายวิธีเพื่อประกอบการตัดสินใจ ดังนี้:
1. การใช้เป็นแนวรับ-แนวต้านแบบไดนามิก (Dynamic Support & Resistance)
* แนวรับ: เมื่อราคาวิ่งลงมาแตะหรือเข้าใกล้เส้นล่าง (เส้นสีน้ำเงิน) เส้นนี้อาจทำหน้าที่เป็นแนวรับชั่วคราวและมีโอกาสที่ราคาจะเด้งกลับขึ้นไปหาเส้นกลาง
* แนวต้าน: เมื่อราคาวิ่งขึ้นไปแตะหรือเข้าใกล้เส้นบน (เส้นสีแดง) เส้นนี้อาจทำหน้าที่เป็นแนวต้านชั่วคราวและมีโอกาสที่ราคาจะย่อตัวลงมา
2. การวัดความผันผวนและสัญญาณ Breakout
* ช่วงตลาดสงบ (Low Volatility): เมื่อเส้น SD ทั้งสองเส้นบีบตัวเข้าหากันเป็นช่องที่แคบมาก (คล้ายกับ Bollinger Squeeze) แสดงว่าตลาดมีความผันผวนต่ำมาก ซึ่งมักจะเป็นสัญญาณว่ากำลังจะเกิดการเคลื่อนไหวครั้งใหญ่ (Breakout)
* ช่วงตลาดเป็นเทรนด์ (High Volatility): เมื่อเส้น SD ขยายตัวกว้างออกอย่างรวดเร็ว พร้อมกับที่ราคาวิ่งอยู่นอกขอบ แสดงว่าตลาดเข้าสู่ช่วงเทรนด์ที่แข็งแกร่งและมีโมเมนตัมสูง
3. สัญญาณการกลับตัว (Reversal Signals)
* เมื่อราคาปิดแท่งเทียน นอกเส้น SD Bands อย่างชัดเจน (โดยเฉพาะหลังจากที่เทรนด์นั้นดำเนินมานาน) อาจเป็นสัญญาณว่าแรงซื้อ/แรงขายเริ่มอ่อนกำลังลง และมีโอกาสที่จะเกิดการกลับตัวของราคาในไม่ช้า
การตั้งค่าอินพุต (Input Parameters):
* ระยะเวลา (Length): กำหนดจำนวนแท่งเทียนที่ใช้ในการคำนวณค่าเฉลี่ยและ SD
* 20: สำหรับการวิเคราะห์ระยะสั้นถึงกลาง
* 50 หรือ 100: สำหรับการวิเคราะห์ระยะยาว
* ตัวคูณ (Multiplier): กำหนดระยะห่างของเส้น SD จากค่าเฉลี่ย
* 1.0 - 2.0: เส้นจะอยู่ใกล้ราคามากขึ้น ทำให้เกิดสัญญาณบ่อยขึ้น
* 2.0 - 3.0: เส้นจะอยู่ห่างจากราคามากขึ้น ทำให้เกิดสัญญาณที่น่าเชื่อถือมากขึ้น แต่จะเกิดไม่บ่อย
ข้อควรระวังและคำเตือน:
* อินดิเคเตอร์นี้เป็นเพียง เครื่องมือวิเคราะห์ เพื่อช่วยในการตัดสินใจ ไม่ใช่สัญญาณการซื้อขายที่ถูกต้อง 100%
* ควรใช้ร่วมกับเครื่องมืออื่นๆ เช่น RSI, MACD, หรือ Volume เพื่อยืนยันสัญญาณ
* การเทรดมีความเสี่ยงสูง ควรบริหารจัดการความเสี่ยงและตั้งจุด Stop Loss ทุกครั้ง
คุณสามารถใช้โครงสร้างนี้ในการเขียนโพสต์บน TradingView ได้เลยนะครับ ขอให้ประสบความสำเร็จกับการโพสต์อินดิเคเตอร์ของคุณครับ!
English
Standard Deviation Bands
Indicator Description:
The SD Bands (Standard Deviation Bands) indicator is a powerful technical analysis tool designed to measure price volatility and identify potential trading opportunities. The indicator displays two dynamic bands directly on the price chart, based on a moving average and a customizable standard deviation multiplier.
* Upper Band: Indicates price levels above the moving average.
* Lower Band: Indicates price levels below the moving average.
The width of the channel between these two bands provides a clear picture of current market volatility.
Detailed User Guide:
You can use SD Bands in several ways to enhance your trading decisions:
1. Dynamic Support and Resistance:
These bands can act as dynamic support and resistance levels.
* Support: When the price moves down and touches or approaches the lower band, it can act as support, offering the possibility of a rebound to the average.
* Resistance: When the price moves up and touches or approaches the upper band, it can act as resistance, offering the possibility of a rebound.
2. Volatility Measurement and Breakout Signals:
* Low Volatility (Squeeze): When the two bands converge and form a narrow channel. Indicates very low market volatility. This condition often occurs before significant price movements or breakouts.
* High Volatility (Expansion): When the bands expand and widen rapidly, it indicates that the market is entering a period of strong trending momentum with high momentum.
3. Reversal Signals:
* When the price closes significantly outside the SD Bands (especially after a long-term trend), it may signal that the current momentum has expired and a reversal may be imminent.
Input Parameters:
The indicator's parameters are fully customizable to suit your trading style:
* Length: Defines the number of bars used to calculate the moving average and standard deviation.
* 20: Suitable for short- to medium-term analysis.
* 50 or 100: Suitable for long-term trend analysis.
* Multiplier: Adjusts the sensitivity of the signal bars.
* 1.0 - 2.0: Creates narrower signal bars, leading to more frequent signals.
* 2.0 - 3.0: Creates wider signal bars, providing fewer but potentially more significant signals.
Important Warning:
* This indicator is an analytical tool only. It does not provide guaranteed buy or sell signals.
* Always use it in conjunction with other indicators (such as RSI, MACD, and Volume) for confirmation.
* Trading involves high risk. Proper risk management, including the use of stop-loss orders, is recommended.
You can use this structure for your posts on TradingView. Good luck with your indicators!
Script open-source
Nello spirito di TradingView, l'autore di questo script lo ha reso open source, in modo che i trader possano esaminarne e verificarne la funzionalità. Complimenti all'autore! Sebbene sia possibile utilizzarlo gratuitamente, ricordiamo che la ripubblicazione del codice è soggetta al nostro Regolamento.
Declinazione di responsabilità
Le informazioni e le pubblicazioni non sono intese come, e non costituiscono, consulenza o raccomandazioni finanziarie, di investimento, di trading o di altro tipo fornite o approvate da TradingView. Per ulteriori informazioni, consultare i Termini di utilizzo.