PROTECTED SOURCE SCRIPT
Electricity Futures x DAM Window Tracking
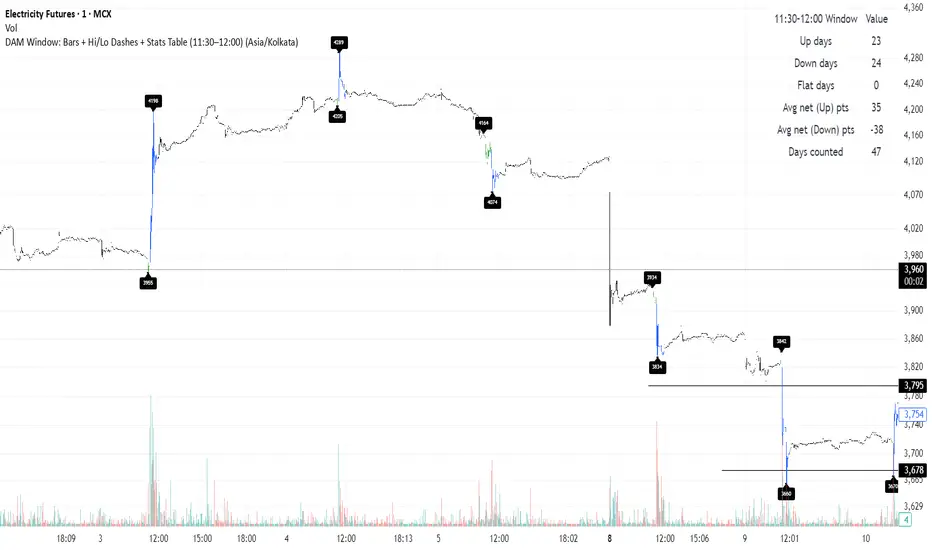
What this one script does
Tracks the OHLC during 11:30–12:00 window per day
Colors bars
11:30–11:45 → Green
11:45–12:00 → Blue
Draws
A horizontal dash at the High and at the Low along with price labels.
Displays a table
Up days - count of days when prices went up post event
Down days - count of days when prices went down post event
Flat days
Avg net change (points) on up days - average of net change on up days
Avg net change (points) on down days - average of net change on down days
Works on 1m / 5m / 15m charts only.
Script protetto
Questo script è pubblicato come codice protetto. Tuttavia, è possibile utilizzarle liberamente e senza alcuna limitazione – ulteriori informazioni qui.
Declinazione di responsabilità
Le informazioni e le pubblicazioni non sono intese come, e non costituiscono, consulenza o raccomandazioni finanziarie, di investimento, di trading o di altro tipo fornite o approvate da TradingView. Per ulteriori informazioni, consultare i Termini di utilizzo.