OPEN-SOURCE SCRIPT
Bearish Gap Down Detection
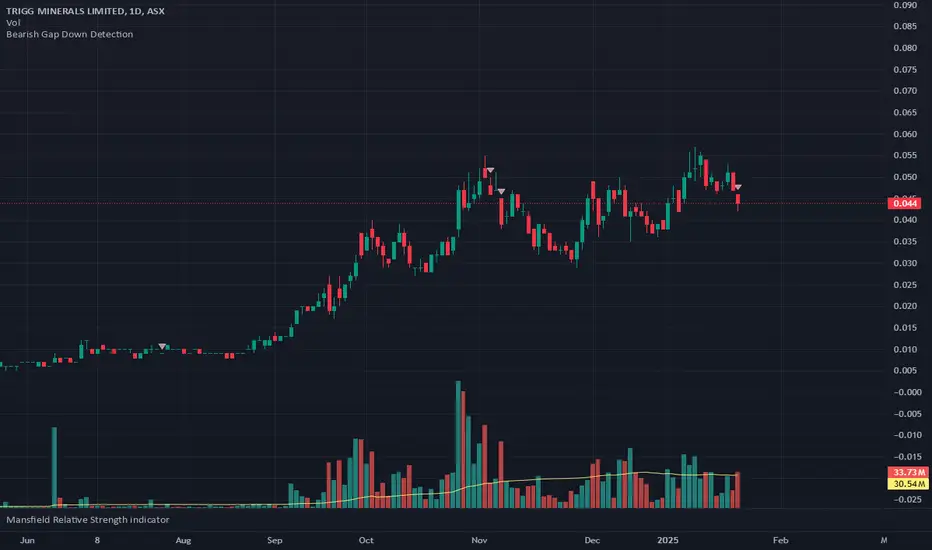
This indicator is designed to identify bearish gap downs in price action and visually mark them on your chart. A gap down occurs when today's opening price is below the previous day's low, and the closing price remains below that low, signaling a potential bearish continuation or reversal.
Features:
Use Cases:
How It Works:
The script detects a gap down when:
When these conditions are met, the indicator plots a red triangle above the price bar, signaling a bearish gap down.
Best Practices:
Apply this script to daily or higher timeframes for more reliable results.
Combine it with other indicators, such as support/resistance levels or volume analysis, for enhanced decision-making.
Features:
- Precise Gap Down Detection: Identifies only confirmed bearish gap downs, avoiding false signals.
- Clear Visual Markers: Marks detected gap downs with a red downward triangle above the bar for easy identification.
- Minimalist Design: Focuses solely on gap down detection, without any reliance on moving averages or additional noise.
Use Cases:
- Trend Reversals: Spot potential downward trends as they develop.
- Momentum Confirmation: Use alongside other indicators or strategies to confirm bearish momentum.
- Swing Trading Opportunities: Ideal for traders looking to capitalize on significant price movements.
How It Works:
The script detects a gap down when:
- Today's opening price is below the previous day's low.
- Today's closing price stays below the previous day's low.
When these conditions are met, the indicator plots a red triangle above the price bar, signaling a bearish gap down.
Best Practices:
Apply this script to daily or higher timeframes for more reliable results.
Combine it with other indicators, such as support/resistance levels or volume analysis, for enhanced decision-making.
Script open-source
Nello spirito di TradingView, l'autore di questo script lo ha reso open source, in modo che i trader possano esaminarne e verificarne la funzionalità. Complimenti all'autore! Sebbene sia possibile utilizzarlo gratuitamente, ricordiamo che la ripubblicazione del codice è soggetta al nostro Regolamento.
Declinazione di responsabilità
Le informazioni e le pubblicazioni non sono intese come, e non costituiscono, consulenza o raccomandazioni finanziarie, di investimento, di trading o di altro tipo fornite o approvate da TradingView. Per ulteriori informazioni, consultare i Termini di utilizzo.