OPEN-SOURCE SCRIPT
Aggiornato Wavechart v2
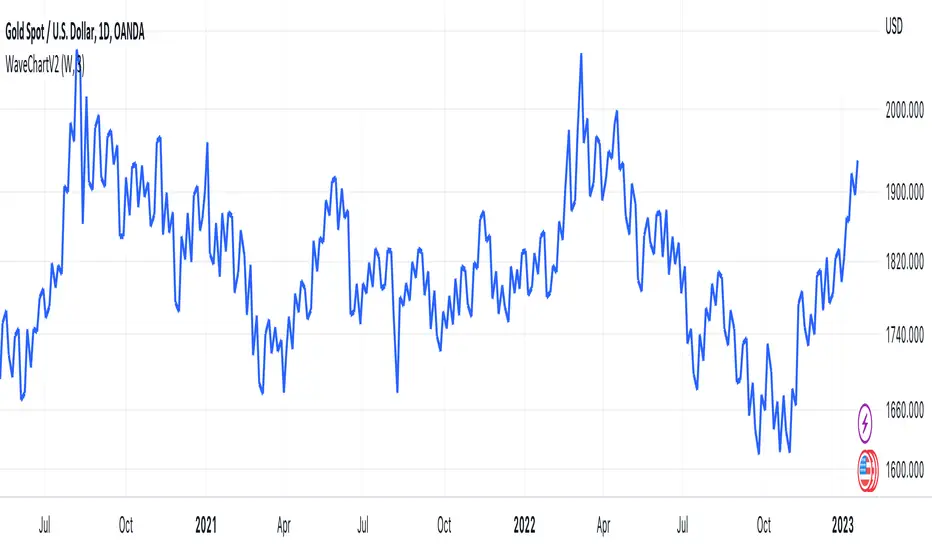
##Wave Chart v2##
For analyzing Neo-wave theory
Plot the market's highs and lows in real-time order.
Then connect the highs and lows
with a diagonal line. Next, the last plot of one day (or bar) is connected with a straight line to the
first plot of the next day (or bar).
For analyzing Neo-wave theory
Plot the market's highs and lows in real-time order.
Then connect the highs and lows
with a diagonal line. Next, the last plot of one day (or bar) is connected with a straight line to the
first plot of the next day (or bar).
Note di rilascio
Chang nameNote di rilascio
- Add line width input - Add Force plot on the last bar
Note di rilascio
Add Timeframe DayNote di rilascio
In some cases, it may be uncertain whether the high or low value should come first, as both values are derived from the same candlestick. We currently assume it is based on the closing price of the candlestick.
However, there is an option in settings to display an unsure line.
To avoid ambiguity, it is recommended to use multiple timeframes for analysis.
Note di rilascio
fix Force plot on the last barNote di rilascio
Add more TimeframeNote di rilascio
fix period divisionNote di rilascio
fix bug assume high low time based on closing price of the candlestickNote di rilascio
Add Timeframe 240,60,30 Note di rilascio
Add timeframe 2W and 2.5YNote di rilascio
fix 2.5yearScript open-source
Nello spirito di TradingView, l'autore di questo script lo ha reso open source, in modo che i trader possano esaminarne e verificarne la funzionalità. Complimenti all'autore! Sebbene sia possibile utilizzarlo gratuitamente, ricordiamo che la ripubblicazione del codice è soggetta al nostro Regolamento.
Declinazione di responsabilità
Le informazioni e le pubblicazioni non sono intese come, e non costituiscono, consulenza o raccomandazioni finanziarie, di investimento, di trading o di altro tipo fornite o approvate da TradingView. Per ulteriori informazioni, consultare i Termini di utilizzo.
Script open-source
Nello spirito di TradingView, l'autore di questo script lo ha reso open source, in modo che i trader possano esaminarne e verificarne la funzionalità. Complimenti all'autore! Sebbene sia possibile utilizzarlo gratuitamente, ricordiamo che la ripubblicazione del codice è soggetta al nostro Regolamento.
Declinazione di responsabilità
Le informazioni e le pubblicazioni non sono intese come, e non costituiscono, consulenza o raccomandazioni finanziarie, di investimento, di trading o di altro tipo fornite o approvate da TradingView. Per ulteriori informazioni, consultare i Termini di utilizzo.