OPEN-SOURCE SCRIPT
Aggiornato FalconRed VIX
The FalconRed Vix indicator is a trading tool designed to provide insights into the potential price range of the Nifty 50 index in India. It utilizes the IndiaVix value, which represents the annual percentage change of the Nifty 50 price. By analyzing the IndiaVix, the FalconRed Vix indicator helps traders determine the upper and lower price thresholds within which the Nifty 50 could potentially trend over the course of a year.
For example, if the Nifty 50 is currently at 18,500 and the IndiaVix is 10, it suggests that, at the given level of volatility, the Nifty 50 may experience price fluctuations of up to 10% in either direction over the course of a year. Consequently, the price range projected by the FalconRed Vix indicator would be between 16,650 and 20,350.
The indicator further extends its analysis to shorter time frames, including monthly, weekly, daily, hourly, 6-hour, 15-minute, 5-minute, and 1-minute intervals. By considering the Vix level, the FalconRed Vix indicator calculates the respective price ranges for these time frames.
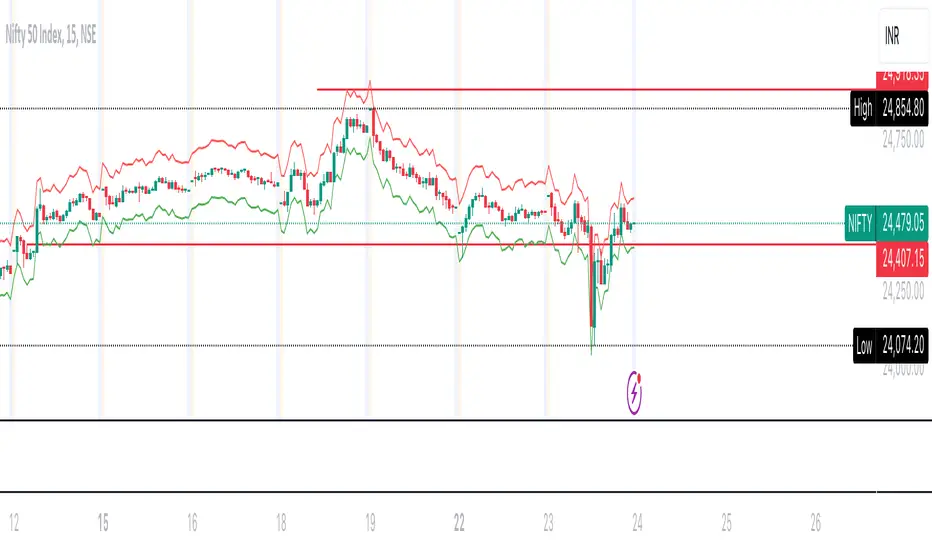
When viewing the indicator on a chart, traders can observe a range band surrounding the current Nifty 50 price. The top line represents the upper threshold of the Nifty 50 price, while the bottom line represents the lower threshold, both based on the Vix level. This range band assists in determining potential selling points for out-of-the-money (OTM) options and aids in identifying entry or exit points for options and futures trading.
Traders can analyze the upper and lower threshold lines by drawing horizontal or trend lines, which can help identify potential breakouts or breakdowns. Furthermore, this analysis can assist in setting target prices and stop losses based on trend analysis.
It is important to note that the FalconRed Vix indicator is not a technical indicator used for determining stock buy or sell signals. Rather, it focuses on defining the potential price range based on the Vix level, which in turn aids in planning trading strategies such as short strangles, iron condors, and others.
For example, if the Nifty 50 is currently at 18,500 and the IndiaVix is 10, it suggests that, at the given level of volatility, the Nifty 50 may experience price fluctuations of up to 10% in either direction over the course of a year. Consequently, the price range projected by the FalconRed Vix indicator would be between 16,650 and 20,350.
The indicator further extends its analysis to shorter time frames, including monthly, weekly, daily, hourly, 6-hour, 15-minute, 5-minute, and 1-minute intervals. By considering the Vix level, the FalconRed Vix indicator calculates the respective price ranges for these time frames.
When viewing the indicator on a chart, traders can observe a range band surrounding the current Nifty 50 price. The top line represents the upper threshold of the Nifty 50 price, while the bottom line represents the lower threshold, both based on the Vix level. This range band assists in determining potential selling points for out-of-the-money (OTM) options and aids in identifying entry or exit points for options and futures trading.
Traders can analyze the upper and lower threshold lines by drawing horizontal or trend lines, which can help identify potential breakouts or breakdowns. Furthermore, this analysis can assist in setting target prices and stop losses based on trend analysis.
It is important to note that the FalconRed Vix indicator is not a technical indicator used for determining stock buy or sell signals. Rather, it focuses on defining the potential price range based on the Vix level, which in turn aids in planning trading strategies such as short strangles, iron condors, and others.
Note di rilascio
The FalconRed Vix indicator is a trading tool designed to provide insights into the potential price range of the Nifty 50 index in India. It utilizes the IndiaVix value, which represents the annual percentage change of the Nifty 50 price. By analyzing the IndiaVix, the FalconRed Vix indicator helps traders determine the upper and lower price thresholds within which the Nifty 50 could potentially trend over the course of a year.For example, if the Nifty 50 is currently at 18,500 and the IndiaVix is 10, it suggests that, at the given level of volatility, the Nifty 50 may experience price fluctuations of up to 10% in either direction over the course of a year. Consequently, the price range projected by the FalconRed Vix indicator would be between 16,650 and 20,350.
The indicator further extends its analysis to shorter time frames, including monthly, weekly, daily, hourly, 6-hour, 15-minute, 5-minute, and 1-minute intervals. By considering the Vix level, the FalconRed Vix indicator calculates the respective price ranges for these time frames.
When viewing the indicator on a chart, traders can observe a range band surrounding the current Nifty 50 price. The top line represents the upper threshold of the Nifty 50 price, while the bottom line represents the lower threshold, both based on the Vix level. This range band assists in determining potential selling points for out-of-the-money (OTM) options and aids in identifying entry or exit points for options and futures trading.
Traders can analyze the upper and lower threshold lines by drawing horizontal or trend lines, which can help identify potential breakouts or breakdowns. Furthermore, this analysis can assist in setting target prices and stop losses based on trend analysis.
It is important to note that the FalconRed Vix indicator is not a technical indicator used for determining stock buy or sell signals. Rather, it focuses on defining the potential price range based on the Vix level, which in turn aids in planning trading strategies such as short strangles, iron condors, and others.
Script open-source
Nello spirito di TradingView, l'autore di questo script lo ha reso open source, in modo che i trader possano esaminarne e verificarne la funzionalità. Complimenti all'autore! Sebbene sia possibile utilizzarlo gratuitamente, ricordiamo che la ripubblicazione del codice è soggetta al nostro Regolamento.
Declinazione di responsabilità
Le informazioni e le pubblicazioni non sono intese come, e non costituiscono, consulenza o raccomandazioni finanziarie, di investimento, di trading o di altro tipo fornite o approvate da TradingView. Per ulteriori informazioni, consultare i Termini di utilizzo.