OPEN-SOURCE SCRIPT
Aggiornato 🟥 Synthetic 10Y Real Yield (US10Y - Breakeven)

This script calculates and plots a synthetic U.S. 10-Year Real Yield by subtracting the 10-Year Breakeven Inflation Rate (USGGBE10) from the nominal 10-Year Treasury Yield (US10Y).
Real yields are a core macro driver for gold, crypto, growth stocks, and bond pricing, and are closely monitored by institutional traders.
The script includes key reference lines:
0% = Below zero = deeply accommodative regime
1.5% = Common threshold used by macro desks to evaluate gold upside breakout conditions
📈 Use this to monitor macro shifts in real-time and front-run capital flows during major CPI, NFP, and Fed events.
Update Frequency: Daily (based on Treasury market data)
Note di rilascio
This script calculates and plots a synthetic U.S. 10-Year Real Yield by subtracting the 10-Year Breakeven Inflation Rate (USGGBE10) from the nominal 10-Year Treasury Yield (US10Y).Real yields are a core macro driver for gold, crypto, growth stocks, and bond pricing, and are closely monitored by institutional traders.
The script includes key reference lines:
0% = Below zero = deeply accommodative regime
1.5% = Common threshold used by macro desks to evaluate gold upside breakout conditions
📈 Use this to monitor macro shifts in real-time and front-run capital flows during major CPI, NFP, and Fed events.
Update Frequency: Daily (based on Treasury market data
Note di rilascio
Real Yield Overlay (Gold-Scaled View)Author: [Saraicy]
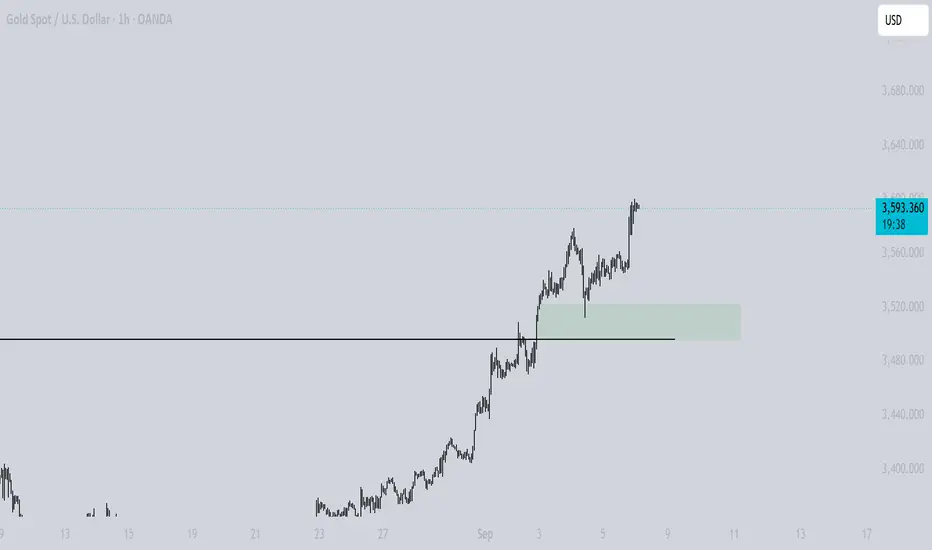
This script overlays the U.S. 10-Year Real Yield directly onto your price chart (e.g. Gold), scaled and aligned to current price levels for intuitive macro correlation tracking.
📈 How it works:
Real Yield Calculation = Nominal 10Y Treasury Yield (FRED:GS10) − 10Y Breakeven Inflation Rate (FRED:T10YIE)
The result is scaled using a custom slope to reflect 0.1% real yield ≈ 200 price units (adjustable).
Overlay is anchored to a reference real yield and price (e.g. 1.6% at 3400), making real yield fluctuations visually interpretable alongside gold price movement.
A dynamic label shows current real yield (%) on the main chart, aligned with price action.
🔍 Use case:
This tool is designed for macro-informed traders, especially gold, Bitcoin, and rates traders, to:
Track inverse correlation between real yields and gold
Visualize monetary policy shifts and bond market reactions in price space
Aid real-time narrative building around inflation, recession risk, and Fed cuts
⚙️ Customizable inputs (in code):
anchor_yield: The real yield to anchor scaling to
anchor_price: The chart price to align with anchor yield
slope: Determines how dramatically real yield changes appear (default: 0.1% = 200pts)
Note di rilascio
### **Real Yield Overlay (Gold-Scaled View)****Author:** [Saraicy]
This script overlays the **U.S. 10-Year Real Yield** directly onto your price chart (e.g. Gold), scaled and aligned to current price levels for intuitive macro correlation tracking.
---
### 📈 **How it works:**
- **Real Yield Calculation** = Nominal 10Y Treasury Yield (FRED:GS10) − 10Y Breakeven Inflation Rate (FRED:T10YIE)
- The result is **scaled** using a custom slope to reflect **0.1% real yield ≈ 200 price units** (adjustable).
- Overlay is anchored to a **reference real yield** and **price** (e.g. 1.6% at 3400), making real yield fluctuations visually interpretable alongside gold price movement.
- A **dynamic label** shows current real yield (%) on the main chart, aligned with price action.
---
### 🔍 **Use case:**
This tool is designed for **macro-informed traders**, especially gold, Bitcoin, and rates traders, to:
- Track **inverse correlation** between real yields and gold
- Visualize **monetary policy shifts** and bond market reactions in price space
- Aid real-time narrative building around inflation, recession risk, and Fed cuts
---
### ⚙️ **Customizable inputs (in code):**
- `anchor_yield`: The real yield to anchor scaling to
- `anchor_price`: The chart price to align with anchor yield
- `slope`: Determines how dramatically real yield changes appear (default: 0.1% = 200pts)
Script open-source
Nello spirito di TradingView, l'autore di questo script lo ha reso open source, in modo che i trader possano esaminarne e verificarne la funzionalità. Complimenti all'autore! Sebbene sia possibile utilizzarlo gratuitamente, ricordiamo che la ripubblicazione del codice è soggetta al nostro Regolamento.
Declinazione di responsabilità
Le informazioni e le pubblicazioni non sono intese come, e non costituiscono, consulenza o raccomandazioni finanziarie, di investimento, di trading o di altro tipo fornite o approvate da TradingView. Per ulteriori informazioni, consultare i Termini di utilizzo.