OPEN-SOURCE SCRIPT
Aggiornato [blackcat] L2 BullBear Oscillator
OVERVIEW
The "[blackcat] L2 BullBear Oscillator" is a custom trading indicator for TradingView that helps traders identify market trends, potential tops and bottoms, and the strength of trends using various moving averages and price relationships.
FEATURES
Calculates a base oscillator based on the close price relative to the highest and lowest prices over the past 60 periods.
Smoothes the oscillator using exponential moving averages (EMAs).
Determines market strength through relative strength indicators and moving averages.
Identifies potential tops and strong support levels based on specific conditions involving oscillators and price actions.
Plots several signals to help traders make informed decisions.
HOW TO USE
Install the script on your TradingView chart.
Customize the settings in the "Inputs" section:
Set the periods for the short-term and long-term EMAs.
Set the periods for the three SMAs used in calculations.
Interpret the plots:
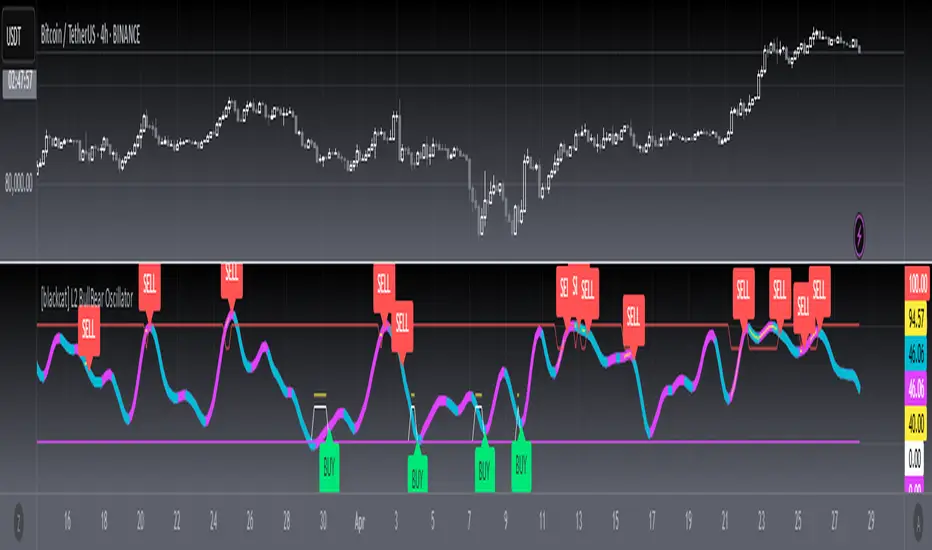
BullBear Signal (Fuchsia Line): Indicates the overall market trend. Uptrends suggest buying opportunities, while downtrends suggest selling.
Decreasing BullBear Signal (Aqua Line): Highlights periods when the trend is weakening or turning bearish, signaling possible selling opportunities.
Potential Top Condition (Yellow Plot): Signals possible trend reversals from bullish to bearish, indicating times to consider taking profits or preparing for a downtrend.
High Price Condition (Yellow Plot): Indicates strong bullish momentum but also potentially overbought conditions, which might precede a correction.
Earning Condition (Red Line): Possibly signifies strong bullish signals, indicating good times to enter long positions.
Strong Support Condition (White Arrows): Signals potential bottoms or support levels, indicating buying opportunities.
Start Hiding Condition (Fuchsia Plot): Might indicate times to exit positions or reduce exposure due to unfavorable market conditions.
ALGORITHMS
Moving Averages:
Simple Moving Averages (SMAs): Used to calculate averages of price data over specified periods.
Exponential Moving Averages (EMAs): Used to give more weight to recent prices, making the moving averages more responsive to new data.
Oscillator Calculation:
The base oscillator is calculated based on the close price's position within the highest and lowest prices over 60 periods, normalized to a 0-100 scale.
This oscillator is then smoothed using EMAs to reduce noise and make trends more visible.
Relative Strength Indicator:
Calculated based on the close price's position within the highest and lowest prices over 20 periods, also normalized to a 0-100 scale.
This is smoothed using SMAs to get a more stable signal.
Condition Checks:
Various conditions are checked to identify potential tops, strong support, and other market states based on the relationships between these indicators and price actions.
LIMITATIONS
The script is based on historical data and does not guarantee future performance.
It is recommended to use the script in conjunction with other analysis tools.
The effectiveness of the strategy may vary depending on the market conditions and asset being traded.
NOTES
The script is designed for educational purposes and should not be considered financial advice.
Users are encouraged to backtest the strategy on a demo account before applying it to live trades.
THANKS
Special thanks to the TradingView community for their support and feedback.
The "[blackcat] L2 BullBear Oscillator" is a custom trading indicator for TradingView that helps traders identify market trends, potential tops and bottoms, and the strength of trends using various moving averages and price relationships.
FEATURES
Calculates a base oscillator based on the close price relative to the highest and lowest prices over the past 60 periods.
Smoothes the oscillator using exponential moving averages (EMAs).
Determines market strength through relative strength indicators and moving averages.
Identifies potential tops and strong support levels based on specific conditions involving oscillators and price actions.
Plots several signals to help traders make informed decisions.
HOW TO USE
Install the script on your TradingView chart.
Customize the settings in the "Inputs" section:
Set the periods for the short-term and long-term EMAs.
Set the periods for the three SMAs used in calculations.
Interpret the plots:
BullBear Signal (Fuchsia Line): Indicates the overall market trend. Uptrends suggest buying opportunities, while downtrends suggest selling.
Decreasing BullBear Signal (Aqua Line): Highlights periods when the trend is weakening or turning bearish, signaling possible selling opportunities.
Potential Top Condition (Yellow Plot): Signals possible trend reversals from bullish to bearish, indicating times to consider taking profits or preparing for a downtrend.
High Price Condition (Yellow Plot): Indicates strong bullish momentum but also potentially overbought conditions, which might precede a correction.
Earning Condition (Red Line): Possibly signifies strong bullish signals, indicating good times to enter long positions.
Strong Support Condition (White Arrows): Signals potential bottoms or support levels, indicating buying opportunities.
Start Hiding Condition (Fuchsia Plot): Might indicate times to exit positions or reduce exposure due to unfavorable market conditions.
ALGORITHMS
Moving Averages:
Simple Moving Averages (SMAs): Used to calculate averages of price data over specified periods.
Exponential Moving Averages (EMAs): Used to give more weight to recent prices, making the moving averages more responsive to new data.
Oscillator Calculation:
The base oscillator is calculated based on the close price's position within the highest and lowest prices over 60 periods, normalized to a 0-100 scale.
This oscillator is then smoothed using EMAs to reduce noise and make trends more visible.
Relative Strength Indicator:
Calculated based on the close price's position within the highest and lowest prices over 20 periods, also normalized to a 0-100 scale.
This is smoothed using SMAs to get a more stable signal.
Condition Checks:
Various conditions are checked to identify potential tops, strong support, and other market states based on the relationships between these indicators and price actions.
LIMITATIONS
The script is based on historical data and does not guarantee future performance.
It is recommended to use the script in conjunction with other analysis tools.
The effectiveness of the strategy may vary depending on the market conditions and asset being traded.
NOTES
The script is designed for educational purposes and should not be considered financial advice.
Users are encouraged to backtest the strategy on a demo account before applying it to live trades.
THANKS
Special thanks to the TradingView community for their support and feedback.
Note di rilascio
OVERVIEW The [blackcat] L2 BullBear Oscillator is a comprehensive trading indicator designed to identify market trends, potential tops, and support levels. It combines multiple moving averages and oscillators to provide detailed insights into market conditions.
FEATURES
• Bull/Bear Market Oscillator with customizable periods
• Multiple SMA and EMA inputs for fine-tuning
• Potential top detection mechanism
• High price condition monitoring
• Earning condition alerts
• Strong support level identification
• Start hiding condition tracking
HOW TO USE
Adjust the input parameters (MA periods) according to your trading strategy
Monitor the BullBear Signal line (fuchsia) for trend direction
Watch for: • Yellow lines indicating potential tops or high price conditions • White line showing strong support levels • Red line signaling earning conditions
Take buy signals when: • Strong support crosses below 25 • Start hiding crosses below 35
Consider sell signals when: • Earning condition crosses above 85
Use alerts for automatic notifications of key conditions
LIMITATIONS
• Past performance does not guarantee future results
• No guarantee of profit or protection against loss
• Should be used in conjunction with other analysis
• Results may vary based on market conditions and timeframes
NOTES
• Default settings are optimized for daily charts
• Backtesting is recommended before live use
• Parameters can be adjusted for different assets and timeframes
• Visual signals are reinforced with alert notifications
Script open-source
Nello spirito di TradingView, l'autore di questo script lo ha reso open source, in modo che i trader possano esaminarne e verificarne la funzionalità. Complimenti all'autore! Sebbene sia possibile utilizzarlo gratuitamente, ricordiamo che la ripubblicazione del codice è soggetta al nostro Regolamento.
Avoid losing contact!Don't miss out! The first and most important thing to do is to join my Discord chat now! Click here to start your adventure: discord.com/invite/ZTGpQJq 防止失联,请立即行动,加入本猫聊天群: discord.com/invite/ZTGpQJq
Declinazione di responsabilità
Le informazioni e le pubblicazioni non sono intese come, e non costituiscono, consulenza o raccomandazioni finanziarie, di investimento, di trading o di altro tipo fornite o approvate da TradingView. Per ulteriori informazioni, consultare i Termini di utilizzo.