OPEN-SOURCE SCRIPT
Multi timeframe trend
DESCRIPTION
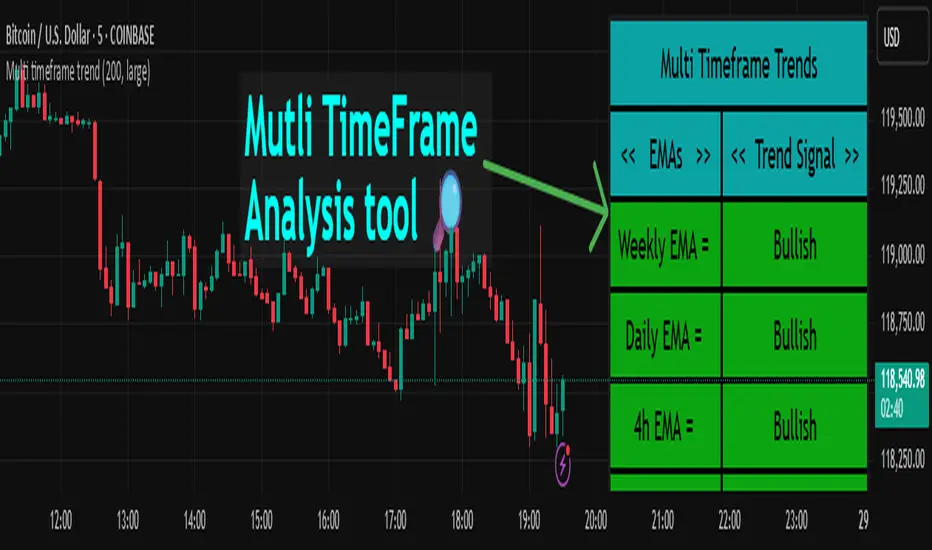
This indicator, Multi Timeframe Trend, is a powerful tool designed to give traders a comprehensive overview of market trends across multiple timeframes using a single, customizable Exponential Moving Average (EMA). It visually displays whether the price is trading above or below the EMA on each timeframe, helping traders quickly determine the dominant trend at a glance.
The real-time dashboard is plotted directly on your chart and color-coded to show bullish (green) or bearish (red) conditions per timeframe, from 15 minutes to 1 week. It is especially helpful for identifying trend alignment across multiple timeframes—an essential component of many professional trading strategies.
USER INPUTS
* Enter the EMA length – Adjust the EMA period used in the trend calculation (default: 200)
* Table Size – Choose how large the on-chart table appears: "tiny", "small", "normal", or "large"
INDICATOR LOGIC
* The indicator calculates the EMA for each of the following timeframes: 1W, 1D, 4H, 1H, 30M, and 15M
* It checks whether the current close is above or below each EMA and labels it as:
* Bullish if close > EMA
* Bearish if close < EMA
* Each timeframe’s trend is displayed in a dynamic table in the top-right corner of the chart
* The background color of each cell changes according to trend condition for quick visual interpretation
* Real-time responsiveness: handles both historical and live bars to maintain accurate, flicker-free updates
WHY IT IS UNIQUE
* Combines multiple timeframe trend analysis into a single glance
* Clean and color-coded dashboard overlay for real-time trading decisions
* Avoids repainting using barstate logic for accurate trend updates
* Fully customizable table size and EMA length
* Works on any chart, including stocks, crypto, forex, indices
HOW USERS CAN BENEFIT FROM IT
* Multi-timeframe confirmation: Easily confirm alignment across timeframes before entering a trade
* Avoid false signals by ensuring higher timeframe trends agree with lower timeframe setups
* Enhance strategy filters: Use as a trend filter in combination with your existing entry indicators
* Quick market analysis: No need to switch between charts or manually calculate EMAs
* Visual clarity: Trend conditions are easy to read and interpret in real-time
Script open-source
Nello spirito di TradingView, l'autore di questo script lo ha reso open source, in modo che i trader possano esaminarne e verificarne la funzionalità. Complimenti all'autore! Sebbene sia possibile utilizzarlo gratuitamente, ricordiamo che la ripubblicazione del codice è soggetta al nostro Regolamento.
Shivam mandai
Declinazione di responsabilità
Le informazioni e le pubblicazioni non sono intese come, e non costituiscono, consulenza o raccomandazioni finanziarie, di investimento, di trading o di altro tipo fornite o approvate da TradingView. Per ulteriori informazioni, consultare i Termini di utilizzo.