OPEN-SOURCE SCRIPT
[Daveatt] BEST Quandl Federal Reserve Economic Dashboard 1.0
Hello traders
I hope you're all doing well and the quarantine will soon be over in your respective countries.
We all have strong opinions on how it could have been handled by our respective governments but the facts cannot be contested.
And basically, they acted based on a lot of unknown data. Obviously, we can throw away some conspiracy theories but what's the point really?
Conspiracy theorists never ever ever ever made money - Permabulls did historically.
Fight only for what you can change, in other words, YOURSELF. Those 2 months were tremendous for me to adapt, learn, and pivot my different businesses.
I believe that humans are wired to one thing - transform themselves. You'll never be able to change our governments, the banks, the FED printing money (making it the dollar less and less valuable)
Transforming yourself and your life is the only (and the most powerful) hedge you have
Yes, you didn't ask for it, this is not fair. Life is not fair. Only YOU can make it fair for yourself
That's why I stopped listening to the media, social media and all the news related to COVID
Context
I wanted to play with the new Quandl utility function provided by TradingView
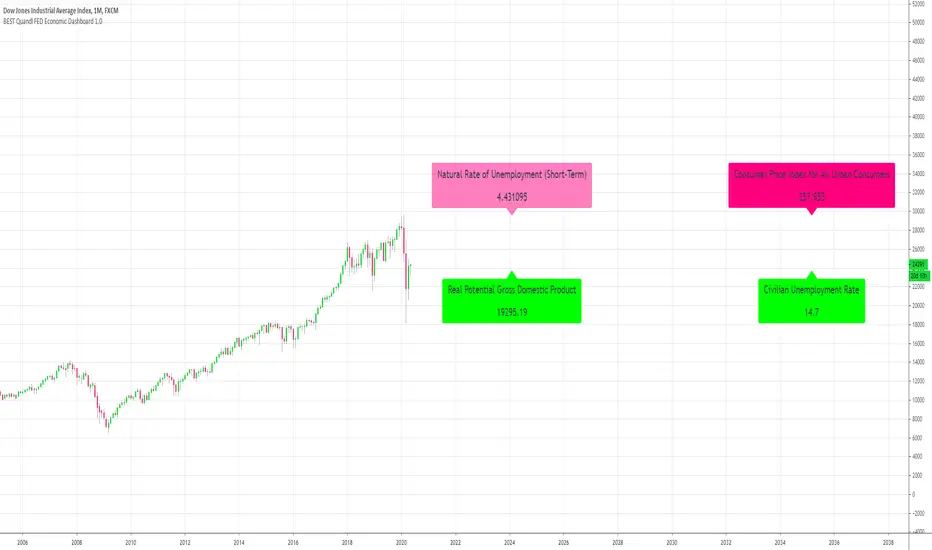
With this dashboard, I tried to build a Quandl dashboard based on the Federal Reserve Economic Data data
I pulled out a few metrics from this Quandl page: quandl.com/data/FRED-Federal-Reserve-Economic-Data/documentation
"Federal Reserve Economic Data" or FRED is a project by the Economic Research Department of the Federal Reserve Bank of St Louis.
FRED collects over 200,000 US and international economic time series, from 69 different sources, on a single website. Data coverage includes all major areas of macroeconomic analysis: growth, inflation, employment, interest rates, exchange rates, production and consumption, income and expenditure, savings and investment, and more.
What can you do with the indicator
First, kudos to Pinecoders. I used his color scale and f_print functions to display those labels at the right.
Script Reference:

You can change from the indicator settings:
- Labels horizontal position
- Labels size (tiny, normal, big, huge)
- Labels colors
Final words
Tough times are ahead as we can see from those numbers.
For those having an online business, it's a fantastic period despite the terrible events. Use it at your advantage to learn and share your vibes and knowledge with your audience
Stay brave,
Dave
I hope you're all doing well and the quarantine will soon be over in your respective countries.
We all have strong opinions on how it could have been handled by our respective governments but the facts cannot be contested.
And basically, they acted based on a lot of unknown data. Obviously, we can throw away some conspiracy theories but what's the point really?
Conspiracy theorists never ever ever ever made money - Permabulls did historically.
Fight only for what you can change, in other words, YOURSELF. Those 2 months were tremendous for me to adapt, learn, and pivot my different businesses.
I believe that humans are wired to one thing - transform themselves. You'll never be able to change our governments, the banks, the FED printing money (making it the dollar less and less valuable)
Transforming yourself and your life is the only (and the most powerful) hedge you have
Yes, you didn't ask for it, this is not fair. Life is not fair. Only YOU can make it fair for yourself
That's why I stopped listening to the media, social media and all the news related to COVID
Context
I wanted to play with the new Quandl utility function provided by TradingView
With this dashboard, I tried to build a Quandl dashboard based on the Federal Reserve Economic Data data
I pulled out a few metrics from this Quandl page: quandl.com/data/FRED-Federal-Reserve-Economic-Data/documentation
"Federal Reserve Economic Data" or FRED is a project by the Economic Research Department of the Federal Reserve Bank of St Louis.
FRED collects over 200,000 US and international economic time series, from 69 different sources, on a single website. Data coverage includes all major areas of macroeconomic analysis: growth, inflation, employment, interest rates, exchange rates, production and consumption, income and expenditure, savings and investment, and more.
What can you do with the indicator
First, kudos to Pinecoders. I used his color scale and f_print functions to display those labels at the right.
Script Reference:
You can change from the indicator settings:
- Labels horizontal position
- Labels size (tiny, normal, big, huge)
- Labels colors
Final words
Tough times are ahead as we can see from those numbers.
For those having an online business, it's a fantastic period despite the terrible events. Use it at your advantage to learn and share your vibes and knowledge with your audience
Stay brave,
Dave
Script open-source
Nello spirito di TradingView, l'autore di questo script lo ha reso open source, in modo che i trader possano esaminarne e verificarne la funzionalità. Complimenti all'autore! Sebbene sia possibile utilizzarlo gratuitamente, ricordiamo che la ripubblicazione del codice è soggetta al nostro Regolamento.
⭐️ I'm looking to sell Best Trading Indicator. DM me if interested
⭐️ Listed as an Official TradingView Trusted TOP Pine Programmer
📧 Coding/Consulting Inquiries: dave@best-trading-indicator.com
⏩ Course: best-trading-indicator.com
⭐️ Listed as an Official TradingView Trusted TOP Pine Programmer
📧 Coding/Consulting Inquiries: dave@best-trading-indicator.com
⏩ Course: best-trading-indicator.com
Declinazione di responsabilità
Le informazioni e le pubblicazioni non sono intese come, e non costituiscono, consulenza o raccomandazioni finanziarie, di investimento, di trading o di altro tipo fornite o approvate da TradingView. Per ulteriori informazioni, consultare i Termini di utilizzo.