OPEN-SOURCE SCRIPT
Navier-Cauchy Market Elasticity [PhenLabs]
📊 Navier-Cauchy Market Elasticity [PhenLabs]
Version: PineScript™ v6
📌 Description
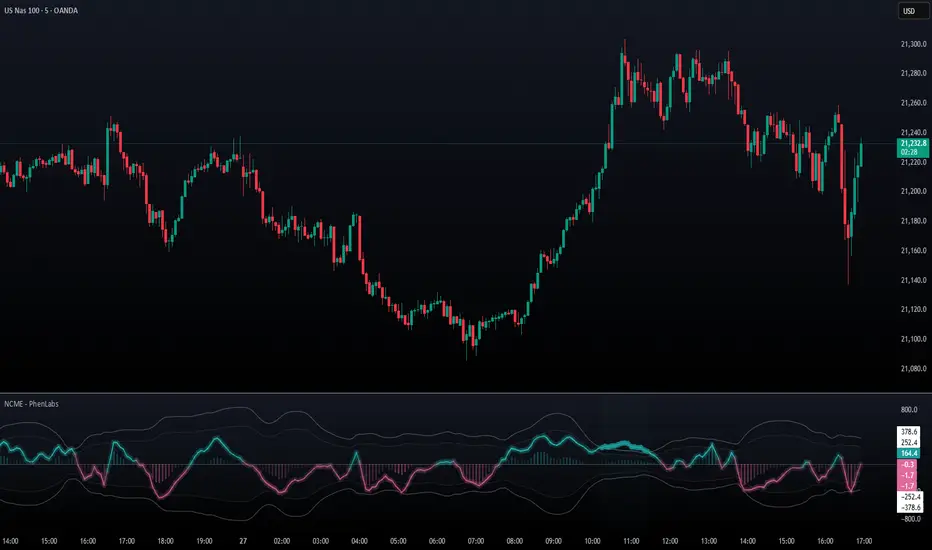
The Navier-Cauchy Market Elasticity (NCME) indicator takes a new step into technical analysis by applying materials science principles to financial markets. Similar to last weeks release utilizing Navier-Stokes dynamics equation this indicator focuses on the elastic interaction of virtual “solids”. Based on elasticity theory used in engineering, NCME treats price movements as material deformations, calculating market stress and strain using proven physics formulas. This unique approach reveals hidden market dynamics invisible to traditional indicators.
By implementing Lamé parameters and Young’s modulus calculations, NCME identifies critical stress points where markets exhibit extreme tension or compression. These zones often precede significant price movements, providing traders with advanced warning of potential reversals or breakouts.
🚀 Points of Innovation
• First indicator to apply Navier-Cauchy elasticity equations to market analysis
• Dynamic stress tensor calculations adapted for one-dimensional price movements
• Real-time Poisson ratio adjustments for market-specific elasticity modeling
• Gradient-based coloring system that visualizes stress intensity variations
• Advanced display modes with customizable visual layers for professional analysis
• Physics-based volatility normalization using Young’s modulus principles
🔧 Core Components
• Elasticity Engine: Calculates market elasticity using volatility-adjusted Young’s modulus
• Stress Tensor System: Computes normal stress values using Lamé parameters (λ and μ)
• Strain Measurement: Tracks price displacement relative to historical movement patterns
• Dynamic Bands: Statistical deviation bands that adapt to market elasticity changes
🔥 Key Features
• Four Display Modes: Choose between Histogram, Line, Both, or Advanced visualization
• Five Color Schemes: Modern, Classic, Neon, Ocean, and Fire themes with gradient support
• Background Stress Zones: Five distinct zones showing market stress levels visually
• Customizable Smoothing: Adjustable period for noise reduction without signal lag
• Extreme Value Detection: Automatic marking of critical stress points with visual alerts
• Advanced Mode Options: Glow effects, momentum ribbon, and extreme dots toggles
🎨 Visualization
• Stress Line: Primary indicator showing real-time market stress with gradient coloring
• Histogram Bars: Normalized stress values with dynamic opacity based on magnitude
• Reference Bands: Primary and secondary deviation bands for context
• Background Zones: Color-coded regions indicating stress intensity levels
• Signal Dots: Markers appearing at extreme stress points for easy identification
📖 Usage Guidelines
Display Settings
• Display Style
○ Default: Advanced
○ Options: Histogram, Line, Both, Advanced
○ Description: Controls visual presentation mode. Advanced offers the most comprehensive view with multiple layers
• Smoothing Period
○ Default: 3
○ Range: 1-50
○ Description: Moving average periods for noise reduction. Higher values create smoother signals but may introduce lag
Elasticity Parameters
• Displacement Length
○ Default: 14
○ Range: 1-100
○ Description: Lookback period for strain calculation. Shorter periods detect rapid stress changes
• Elasticity Length
○ Default: 30
○ Range: 1-200
○ Description: Period for volatility-based elasticity calculation. Longer periods provide more stable readings
• Poisson Ratio
○ Default: 0.3
○ Range: 0-0.5
○ Description: Theoretical elasticity ratio. 0.3 works well for most markets; adjust for specific asset classes
✅ Best Use Cases
• Identifying market tension before major breakouts
• Detecting compression zones during accumulation phases
• Confirming trend strength through stress persistence
• Timing reversals at extreme stress levels
• Multi-timeframe stress analysis for comprehensive market view
⚠️ Limitations
• Requires sufficient price history for accurate elasticity calculations
• May produce false signals during unprecedented market events
• Works best in liquid markets with consistent volume
• Not suitable as a standalone trading system
💡 What Makes This Unique
• Physics-Based Foundation: First indicator to properly implement elasticity theory
• Academic Rigor: Based on proven Navier-Cauchy equations from materials science
• Visual Innovation: Multiple display modes with professional-grade aesthetics
• Adaptive Technology: Self-adjusting parameters based on market conditions
🔬 How It Works
1. Strain Calculation:
• Measures price displacement over specified period
• Normalizes displacement relative to price level
2. Elasticity Determination:
• Calculates Young’s modulus using inverse volatility
• Updates Lamé parameters based on Poisson ratio
3. Stress Computation:
• Applies elasticity theory formula: σ = (λ + 2μ) × ε
• Scales result for visual clarity
• Applies smoothing to reduce noise
Version: PineScript™ v6
📌 Description
The Navier-Cauchy Market Elasticity (NCME) indicator takes a new step into technical analysis by applying materials science principles to financial markets. Similar to last weeks release utilizing Navier-Stokes dynamics equation this indicator focuses on the elastic interaction of virtual “solids”. Based on elasticity theory used in engineering, NCME treats price movements as material deformations, calculating market stress and strain using proven physics formulas. This unique approach reveals hidden market dynamics invisible to traditional indicators.
By implementing Lamé parameters and Young’s modulus calculations, NCME identifies critical stress points where markets exhibit extreme tension or compression. These zones often precede significant price movements, providing traders with advanced warning of potential reversals or breakouts.
🚀 Points of Innovation
• First indicator to apply Navier-Cauchy elasticity equations to market analysis
• Dynamic stress tensor calculations adapted for one-dimensional price movements
• Real-time Poisson ratio adjustments for market-specific elasticity modeling
• Gradient-based coloring system that visualizes stress intensity variations
• Advanced display modes with customizable visual layers for professional analysis
• Physics-based volatility normalization using Young’s modulus principles
🔧 Core Components
• Elasticity Engine: Calculates market elasticity using volatility-adjusted Young’s modulus
• Stress Tensor System: Computes normal stress values using Lamé parameters (λ and μ)
• Strain Measurement: Tracks price displacement relative to historical movement patterns
• Dynamic Bands: Statistical deviation bands that adapt to market elasticity changes
🔥 Key Features
• Four Display Modes: Choose between Histogram, Line, Both, or Advanced visualization
• Five Color Schemes: Modern, Classic, Neon, Ocean, and Fire themes with gradient support
• Background Stress Zones: Five distinct zones showing market stress levels visually
• Customizable Smoothing: Adjustable period for noise reduction without signal lag
• Extreme Value Detection: Automatic marking of critical stress points with visual alerts
• Advanced Mode Options: Glow effects, momentum ribbon, and extreme dots toggles
🎨 Visualization
• Stress Line: Primary indicator showing real-time market stress with gradient coloring
• Histogram Bars: Normalized stress values with dynamic opacity based on magnitude
• Reference Bands: Primary and secondary deviation bands for context
• Background Zones: Color-coded regions indicating stress intensity levels
• Signal Dots: Markers appearing at extreme stress points for easy identification
📖 Usage Guidelines
Display Settings
• Display Style
○ Default: Advanced
○ Options: Histogram, Line, Both, Advanced
○ Description: Controls visual presentation mode. Advanced offers the most comprehensive view with multiple layers
• Smoothing Period
○ Default: 3
○ Range: 1-50
○ Description: Moving average periods for noise reduction. Higher values create smoother signals but may introduce lag
Elasticity Parameters
• Displacement Length
○ Default: 14
○ Range: 1-100
○ Description: Lookback period for strain calculation. Shorter periods detect rapid stress changes
• Elasticity Length
○ Default: 30
○ Range: 1-200
○ Description: Period for volatility-based elasticity calculation. Longer periods provide more stable readings
• Poisson Ratio
○ Default: 0.3
○ Range: 0-0.5
○ Description: Theoretical elasticity ratio. 0.3 works well for most markets; adjust for specific asset classes
✅ Best Use Cases
• Identifying market tension before major breakouts
• Detecting compression zones during accumulation phases
• Confirming trend strength through stress persistence
• Timing reversals at extreme stress levels
• Multi-timeframe stress analysis for comprehensive market view
⚠️ Limitations
• Requires sufficient price history for accurate elasticity calculations
• May produce false signals during unprecedented market events
• Works best in liquid markets with consistent volume
• Not suitable as a standalone trading system
💡 What Makes This Unique
• Physics-Based Foundation: First indicator to properly implement elasticity theory
• Academic Rigor: Based on proven Navier-Cauchy equations from materials science
• Visual Innovation: Multiple display modes with professional-grade aesthetics
• Adaptive Technology: Self-adjusting parameters based on market conditions
🔬 How It Works
1. Strain Calculation:
• Measures price displacement over specified period
• Normalizes displacement relative to price level
2. Elasticity Determination:
• Calculates Young’s modulus using inverse volatility
• Updates Lamé parameters based on Poisson ratio
3. Stress Computation:
• Applies elasticity theory formula: σ = (λ + 2μ) × ε
• Scales result for visual clarity
• Applies smoothing to reduce noise
💡 Note: NCME represents a breakthrough in applying physics principles to market analysis. While based on proven scientific formulas, remember that markets are complex systems influenced by human psychology and external factors. Use NCME as part of a comprehensive trading strategy with proper risk management.
Script open-source
Nello spirito di TradingView, l'autore di questo script lo ha reso open source, in modo che i trader possano esaminarne e verificarne la funzionalità. Complimenti all'autore! Sebbene sia possibile utilizzarlo gratuitamente, ricordiamo che la ripubblicazione del codice è soggetta al nostro Regolamento.
TradingView Charting w/ Crypto Systems: phenlabs.com
Join our growing community: discord.gg/phen
All content provided by PhenLabs is for informational & educational purposes only. Past performance does not guarantee future results.
Join our growing community: discord.gg/phen
All content provided by PhenLabs is for informational & educational purposes only. Past performance does not guarantee future results.
Declinazione di responsabilità
Le informazioni e le pubblicazioni non sono intese come, e non costituiscono, consulenza o raccomandazioni finanziarie, di investimento, di trading o di altro tipo fornite o approvate da TradingView. Per ulteriori informazioni, consultare i Termini di utilizzo.