OPEN-SOURCE SCRIPT
CryptoScalp v2.1
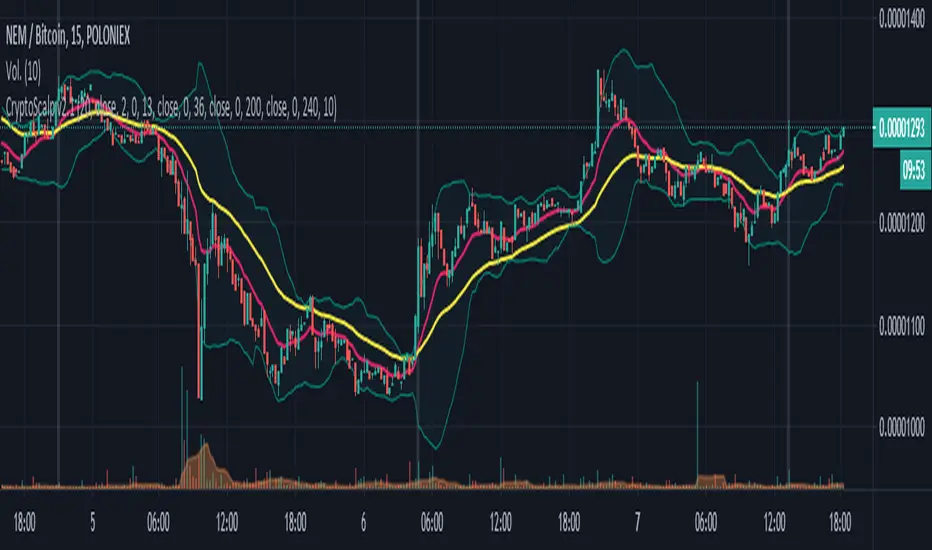
CryptoScalp is a script that will allow us to identify possible entries while we do scalping, it is not of absolute truth but rather marks us a possible entry, the decision to enter or not is ours!
To use it, just add it to the graph we want to analyze, it has the following values preconfigured:
Bollinger Bands (BB Length): 20
Fast EMA (EMA 0 Length): 13
Slow EMA (EMA 1 Length): 36
EMA 2 (support | resistance): 200
EMA 2 Period (only appears in the configured period, 4h): 240
Volume MA: 10
Playing with these values will allow us to find our strategy.
How does the script work?
Basically, to mark a possible entry, in principle it controls that the Volume exceeds the Average of the configured Volume (Volume MA), and after the fast EMA (EMA 0) crosses over the slow EMA (EMA 1), if these conditions are met, it paints a background bar to identify a simple look at the crossing, and as said at the beginning, the decision is ours!
I hope it will be of help to you as it is being for me!
Script open-source
Nello spirito di TradingView, l'autore di questo script lo ha reso open source, in modo che i trader possano esaminarne e verificarne la funzionalità. Complimenti all'autore! Sebbene sia possibile utilizzarlo gratuitamente, ricordiamo che la ripubblicazione del codice è soggetta al nostro Regolamento.
Declinazione di responsabilità
Le informazioni e le pubblicazioni non sono intese come, e non costituiscono, consulenza o raccomandazioni finanziarie, di investimento, di trading o di altro tipo fornite o approvate da TradingView. Per ulteriori informazioni, consultare i Termini di utilizzo.