Liquidity Triggers
Liquidity Triggers indicate:
- Where liquidity-derived support levels are.
- Where liquidity-derived resistance levels are.
- When a large price increase is approaching via the Rip Currents.
- - When a large price decrease is approaching via the Dip Currents.
Summary
Liquidity Triggers are produced by measuring liquidity and determining where supportive liquidity and resistance-liquidity are. These trigger-levels designate price-points where breakouts, breakthroughs, and bounces are anticipated.
Liquidity Triggers are dynamic, and they constantly re-evaluate liquidity conditions to determine where the next group of sellers or buyers are that can fuel rapid changes in price movement, such as initiating a trend change or stalling price-action completely.
To use, simply apply to your chart and monitor for Supportive Liquidity Triggers (LTs that are below price) for bounces, and Resistance Liquidity Triggers (LTs that are above price) for rejections.
You can also set Alerts designed specifically around the Liquidity Triggers.
Examples
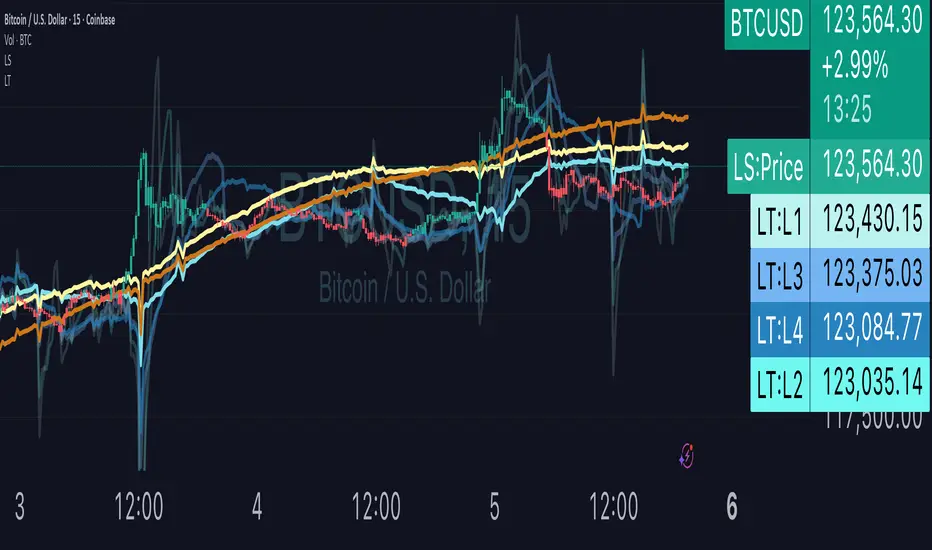
Example 1: A quick look at LT Resistances and Supports. When a LT is above spot, then it is considered a resistance. When LT is below spot, it is considered a support.
Example 2: LTs can indicate to us when an upcoming Rip Current (large price appreciation) or a Dip Current (large price depreciation) is starting.
Here is an example of a Rip Current:
And here is a Dip Current:
Details
Liquidity Triggers come with a default load-out that utilizes several pre-configured settings for quick and easy start-up.
Triggers
The default triggers are labeled LT-1 through LT-7, these correspond `orders` that describe which type of liquidity is monitored. The two groups of traders that are monitored are the `Eager` and the `Organic`.
The default triggers use the Fibonacci sequence to adjust their orders in a standardized way.
Triggers 1, 2, 3, and 4 monitor the `Eager` traders (with default settings) while triggers 5, 6, and 7 monitor the `Organic`traders.
Eager Triggers represent profit-takers and dip-buyers.
When the Eager Triggers are above the price, they are `selling the rip`, and when the Eager Triggers are below price, they are `buying the dip`. These moments indicate growing pressure for a reversal. Eager triggers are any trigger with an order of 89 or less.
Organic Triggers represent value-seekers with long-term goals. When they are below price, they are areas of support and tend to fuel bounces, while when organic triggers that are above price are areas of resistance and often provoke rejections. Organic triggers are any trigger with an order of 90 or more.
Here's an example showing the faint eager liquidity triggers above spot, indicating profit-taking and below spot after a price-dip indicating dip-buying.
Customization
There are additional settings and configurations available to the Liquidity Triggers indicator that help customize your view of liquidity.
Smoothing
Smoothing can be applied to the triggers for a more peaceful showing. The smoothing options are:
- None - Default.
- Exponential-Moving Average (EMA) : Ideal for when you want the most recent activity to take higher priority.
- Simple-Moving Average (SMA) : Ideal for when you want a smoother appearance but do not want to change the data too much.
- Weighted-Moving Average (WMA): Ideal for when you want the smoothing to increase as the trigger order increases.
- Modified-Moving Average (RMA): Produces the most smooth data.
Here is an example of how smoothing can change the appearance of LTs for easier analysis for when things get complicated:
Modifying the Default Load-out
The default loadout attempts to balance having a wide view of the data without bringing too many lines or values into the picture that might be too noisy, but these values can be added to customize and expand your view if desired.
The Fib load-out has the options [5, 8, 13, 21, 34, 55, 89, 144, 377, 610, 987, 1597] with the default load-out being [5, 13, 34, 55, 144, 377, 610].
Feel free to mix and match and explore which views you prefer when analyzing liquidity.
For example, for the extreme data-heads, you can add LDPM twice on the chart to get all of the orders displayed at once:
Liquidity Triggers - Granular Triggers
The granular trigger can be toggled on (default: off) for when candle-specific liquidity measurements desired. They can help identify which specific candles have eager and aggressive traders attempting to move spot: the further away the granular trigger is from the candle, the more force is being applied!
Manual LTs
If you’re not satisfied with the default options for triggers, you can set your own with the Manual Liquidity Triggers option.
Time-Based LTs
Time-based liquidity triggers give you a view of support and resistance triggers based off of the time chosen, rather than by an order. This allows you to construct “weekly Liquidity-Triggers” or “hourly Liquidity Triggers” to analyze and compare against.
Note: If the timeframes are too far apart, you might get an error. For instance, putting a 1-week reference LT onto a 30-second chart may not work.
Liquidity-Triggers Data-Table
With the `Display Liquidity Trigger Statuses and Values` option, you can place a data-table on the chart that will display the time-based triggers, their values, and if they are above (bearish) or below (bullish) spot.
Alerts
When you set alerts, you can determine which order is used for determining `Is bullish`, `Is Bearish`, `Has Become Bullish`, `Has Become Bearish` alerts in the LT Alert Order setting.
Several LT alerts are available to set:
- Is Bullish / Bearish: these are designed to analyze conditions at the end of the candle and if spot is above the alert-trigger, then an alert is sent out that conditions are bullish, and if spot is below the alert-trigger, then an alert is sent out if conditions are bearish.
- Has Become Bullish / Bearish: designed to analyze conditions at the start of a candle and determine if a change has occurred (a LT cross-over).
- Suspected Rip Current: these are designed to alert you when a suspected upwards rip in price is underway, as characterized by all LT triggers moving rapidly down away from spot.
- Suspected Dip Current: these are designed to alert you when a suspected downwards rip in price is underway, as characterized by all LT triggers moving rapidly up and above, away from spot.
These alerts can then be put into a webhook for external processing if desired.
Frequently Asked Questions
How can I gain access to LT?
Check out the Author's Instructions section below.
Where can I get more information?
Check out the Author's Instructions section below for how to obtain more information.
I tried to add LT to my chart but it produced an error.
Sometimes this happens but no worries. Just change the chart's interval to a different time and then back, the indicator should re-load. If that fails, try removing it completely and re-applying it.
Is it normal for LTs to have different values on different timeframes?
Yup! Think of each time-interval as a different "zoom" of the market. Imagine you are taking a picture of the ocean to figure out the direction of water movement. If you take the picture from space, you will see big general trends but if you take the photo from your boat in the harbor, you're going to get specific data about that area. That's how LT works!
The view of the liquidity depends on the "zoom-age" (the chart's interval) used when taking the photo.
I think there is an issue with the alerts - what should I do?
This is not ideal! If this happens, please reach out via the contact information in the Author's Instructions section below with the following details:
- What symbol?
- What timeframe?
- Which alert?
- When did the alert occur?
Can I attach the alerts to webhooks?
Yup! Be sure to check out TV's guide on webhooks (T.V. Guide to Alerts) for how to get started.
Does LT receive updates?
Yup! If a bug or issue is found, an update is pushed out. You will be notified when this occurs and it is highly recommended that you replace all charts with LT on them with the new version as the updates go out.
Script su invito
Solo gli utenti approvati dall'autore possono accedere a questo script. È necessario richiedere e ottenere l'autorizzazione per utilizzarlo. Tale autorizzazione viene solitamente concessa dopo il pagamento. Per ulteriori dettagli, seguire le istruzioni dell'autore riportate di seguito o contattare direttamente DeepDiveStocks.
TradingView NON consiglia di acquistare o utilizzare uno script a meno che non si abbia piena fiducia nel suo autore e se ne comprenda il funzionamento. È inoltre possibile trovare alternative gratuite e open source nei nostri script della community.
Istruzioni dell'autore
Declinazione di responsabilità
Script su invito
Solo gli utenti approvati dall'autore possono accedere a questo script. È necessario richiedere e ottenere l'autorizzazione per utilizzarlo. Tale autorizzazione viene solitamente concessa dopo il pagamento. Per ulteriori dettagli, seguire le istruzioni dell'autore riportate di seguito o contattare direttamente DeepDiveStocks.
TradingView NON consiglia di acquistare o utilizzare uno script a meno che non si abbia piena fiducia nel suo autore e se ne comprenda il funzionamento. È inoltre possibile trovare alternative gratuite e open source nei nostri script della community.