OPEN-SOURCE SCRIPT
CM_Blast_Off_V1_Alerts Ready
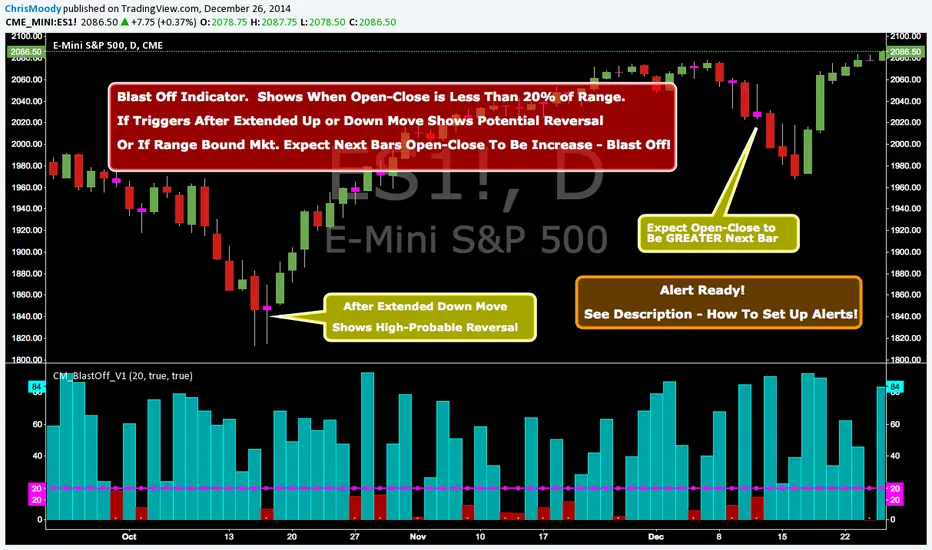
Blast Off Indicator - Alert Ready!!!
Created By Request from @elpuerto936c
Description of Indicator:
***This measures the day's open / close vs then high lows of the day (range)
***When the open /close is less than 20% of the range, then it's likely that the following day will have a big jump.
***The Thought Process is Simply When (Open - Close) is Less Than 20% Of The Range…Shows Indecision and Breakout is Probable.
***Which way? Use whatever indicator you want to figure out if the market is oversold or overbought.
***NOTE: If Indicator Triggers After Extended Up or Down Move…This = High Probability Reversal.
In Inputs Tab:
-Ability to Change The Trigger Value…(This is Percent The (Open-Close) is to the Total RANGE of The Bar).
-Ability to Turn On/Off Highlight Bars via Check Box.
To Set Alert:
-In First Drop Down Box Select Name of Indicator
-In Drop Down to Right Select “Alert Blast Off If Below Trigger”.
-Then Select “Greater Than”.
-Then Select “Value”
-To the Right of Value type in .99
-Select On Bar Close, If not you will get FALSE Alerts.
Script open-source
Nello spirito di TradingView, l'autore di questo script lo ha reso open source, in modo che i trader possano esaminarne e verificarne la funzionalità. Complimenti all'autore! Sebbene sia possibile utilizzarlo gratuitamente, ricordiamo che la ripubblicazione del codice è soggetta al nostro Regolamento.
Coming Soon: ChrisMoodyTrading.com
Declinazione di responsabilità
Le informazioni e le pubblicazioni non sono intese come, e non costituiscono, consulenza o raccomandazioni finanziarie, di investimento, di trading o di altro tipo fornite o approvate da TradingView. Per ulteriori informazioni, consultare i Termini di utilizzo.