OPEN-SOURCE SCRIPT
Aggiornato HVC Daily Levels
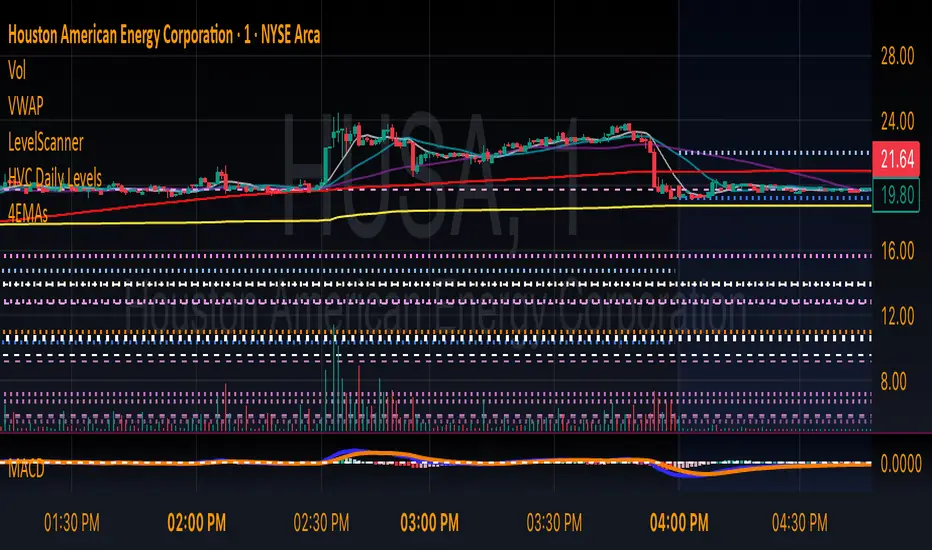
Daily High Volume Candle Levels Marked on all Timeframes
HVC Level Sentinel v6 — High Volume Candle Levels
HVC Level Sentinel v6 automatically detects and highlights “High Volume Candles” (HVCs) — bars with the highest trading volume in a rolling, user-defined window (e.g., 30 days). This tool helps you spot key price levels where significant trading activity occurred, which can act as important support or resistance zones.
Features
Customizable Lookback: Choose how many bars to look back for HVC detection (default: 30 days, adjustable).
Automatic Highlighting: HVC candles are highlighted on your chart with a customizable color.
Level Lines: Draws horizontal lines at the Open, High, Low, and Close of each recent HVC, so you can easily track these key levels.
Line Fading: Only the most recent N HVCs (user-adjustable) have lines, with older lines fading out or disappearing for clarity.
Per-Line Control: Turn on/off Open, High, Low, and Close lines individually in the settings.
Fully Customizable: Adjust colors, line styles, widths, and opacity to fit your chart style.
How It Works
On each new bar, the script checks if the current bar’s volume is the highest in the last N bars.
If so, it marks the bar as an HVC and draws lines at its O/H/L/C (if enabled).
You can highlight all HVCs historically, but only the most recent N will have lines for a clean, focused chart.
Use Cases
Identify major breakout or reversal points driven by high volume.
Track where institutional or “smart money” activity may have occurred.
Use HVC levels as dynamic support/resistance for entries, exits, or stop placement.
Tip:
Adjust the lookback window and number of HVCs with lines to match your trading style—shorter for active trading, longer for swing/position trading.
Note di rilascio
Daily High Volume Candle Levels Marked on all TimeframesHVC Level Sentinel v6 — High Volume Candle Levels
HVC Level Sentinel v6 automatically detects and highlights “High Volume Candles” (HVCs) — bars with the highest trading volume in a rolling, user-defined window (e.g., 30 days). This tool helps you spot key price levels where significant trading activity occurred, which can act as important support or resistance zones.
Features
Customizable Lookback: Choose how many bars to look back for HVC detection (default: 30 days, adjustable).
Automatic Highlighting: HVC candles are highlighted on your chart with a customizable color.
Level Lines: Draws horizontal lines at the Open, High, Low, and Close of each recent HVC, so you can easily track these key levels.
Line Fading: Only the most recent N HVCs (user-adjustable) have lines, with older lines fading out or disappearing for clarity.
Per-Line Control: Turn on/off Open, High, Low, and Close lines individually in the settings.
Fully Customizable: Adjust colors, line styles, widths, and opacity to fit your chart style.
How It Works
On each new bar, the script checks if the current bar’s volume is the highest in the last N bars.
If so, it marks the bar as an HVC and draws lines at its O/H/L/C (if enabled).
You can highlight all HVCs historically, but only the most recent N will have lines for a clean, focused chart.
Use Cases
Identify major breakout or reversal points driven by high volume.
Track where institutional or “smart money” activity may have occurred.
Use HVC levels as dynamic support/resistance for entries, exits, or stop placement.
Tip:
Adjust the lookback window and number of HVCs with lines to match your trading style—shorter for active trading, longer for swing/position trading.
Script open-source
Nello spirito di TradingView, l'autore di questo script lo ha reso open source, in modo che i trader possano esaminarne e verificarne la funzionalità. Complimenti all'autore! Sebbene sia possibile utilizzarlo gratuitamente, ricordiamo che la ripubblicazione del codice è soggetta al nostro Regolamento.
Declinazione di responsabilità
Le informazioni e le pubblicazioni non sono intese come, e non costituiscono, consulenza o raccomandazioni finanziarie, di investimento, di trading o di altro tipo fornite o approvate da TradingView. Per ulteriori informazioni, consultare i Termini di utilizzo.