OPEN-SOURCE SCRIPT
KT HMA
Overview :
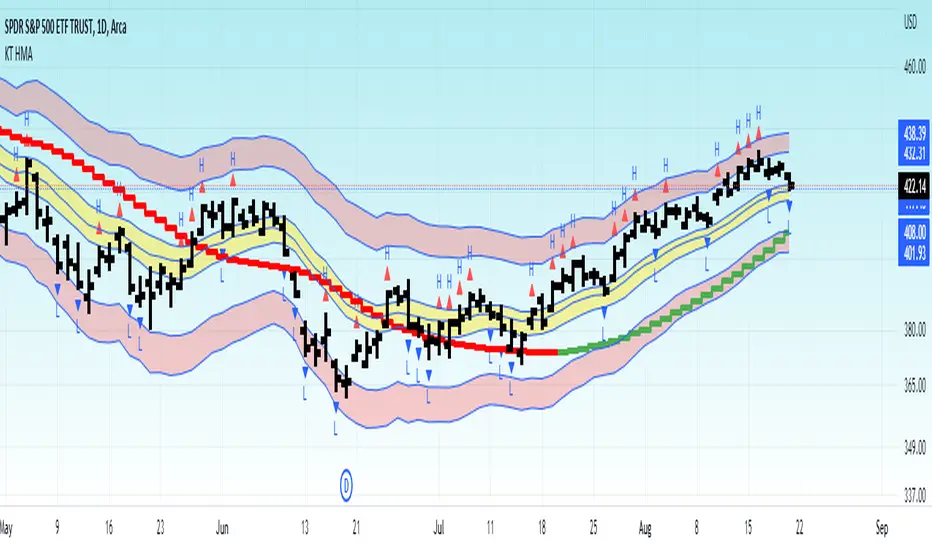
This indicator is an experiment to combine one of the volatility concepts (ATR), weighted MA and price movements to help visualize current market condition.
Red Band : ATR volatility bands with 2nd and 3rd standard deviation.
Yellow Band : Moving Average band
HMA : Green/Red >> Shows current trend. Using HMA to emphasize on recent price points rather than older one.
-----------------
Disclaimer
My Scripts/Indicators/Ideas/Systems including above ones are only for educational purposes. The information contained in the Scripts/Indicators/Ideas does not constitute financial advice or a solicitation to buy or sell any securities of any type. All investments involve risk, and the past performance of a security, industry, sector, market, financial product, trading strategy, backtest, or individual's trading does not guarantee future results or returns. Do not trade with capital that you can not afford to lose. Investors are fully responsible for any investment decisions they make. Such decisions should be based solely on an evaluation of their financial circumstances, investment objectives, risk tolerance, and liquidity needs.
Script open-source
Nello spirito di TradingView, l'autore di questo script lo ha reso open source, in modo che i trader possano esaminarne e verificarne la funzionalità. Complimenti all'autore! Sebbene sia possibile utilizzarlo gratuitamente, ricordiamo che la ripubblicazione del codice è soggetta al nostro Regolamento.
Declinazione di responsabilità
Le informazioni e le pubblicazioni non sono intese come, e non costituiscono, consulenza o raccomandazioni finanziarie, di investimento, di trading o di altro tipo fornite o approvate da TradingView. Per ulteriori informazioni, consultare i Termini di utilizzo.