PROTECTED SOURCE SCRIPT
BTC Spot/Perp Price Delta
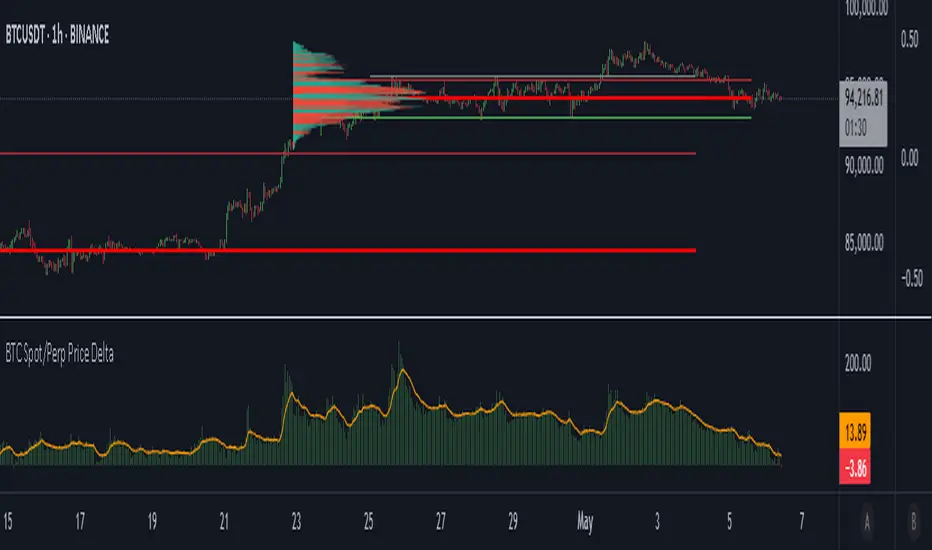
The indicator gathers price from 3 btc spot pairs (largest by volume) and 3 btc perp pairs (also largest by volume).
The average Spot and Perp prices are then derived.
The indicator plots the price difference between the Spot average and the Perps average (Spot minus Perps).
Green plot above the zero line means Spot price is higher than the Perp price at a candle close - Contango.
Red plot below the zero line means Spot Price is lower than the Perp price at a candle close - Backwardation.
The orange line is the EMA. Default value is 100 periods. Changeable by User.
Use cases:
1. Perp market is way larger than the Spot market, measured by traded Volume. We may say that the Perps market is more "stable", because it is more liquid. When Spot price deviates a lot from the Perps price, in both positive and negative directions, we may expect a mean reversion.
High Green or Red indicator values = expect price reversion.
2. Helps to observe absorption. If the indicator values are high (in both directions), but the price is barely moving, we can come to a conclusion that the opposite side Limit orders are being deployed to absorb Spot market orders.
Typically, this also indicates mean reversion.
3. You are welcome to use the indicator and perhaps find your own use cases.
Any suggestions on how to improve this indicator are welcome.
Script protetto
Questo script è pubblicato come codice protetto. Tuttavia, è possibile utilizzarle liberamente e senza alcuna limitazione – ulteriori informazioni qui.
Declinazione di responsabilità
Le informazioni e le pubblicazioni non sono intese come, e non costituiscono, consulenza o raccomandazioni finanziarie, di investimento, di trading o di altro tipo fornite o approvate da TradingView. Per ulteriori informazioni, consultare i Termini di utilizzo.