PROTECTED SOURCE SCRIPT
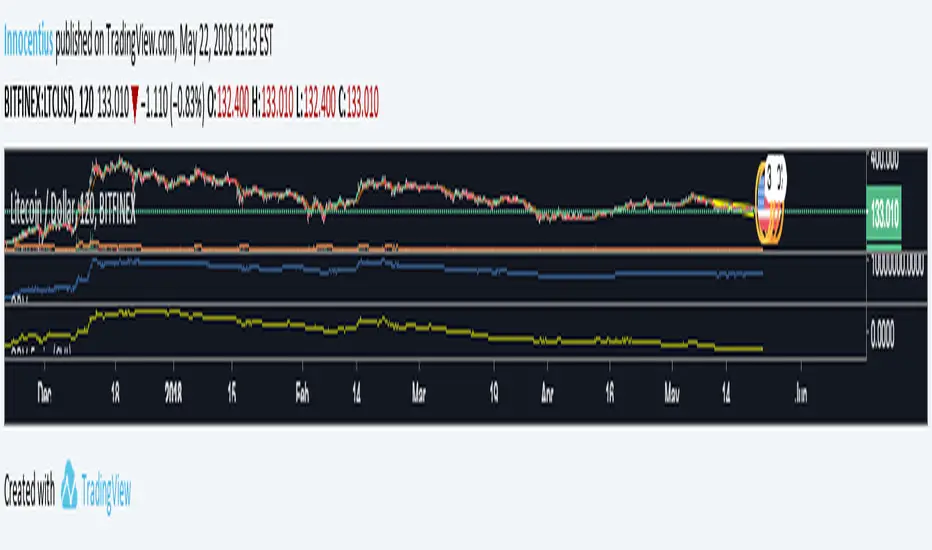
On Balance Volume locked 5min (CVI)

OBV shows the cumulation of the volume bars. All the volume in a green bar gets added to the obv and all the volume in a red bar gets subtracted. At a higher timeframe this can be misleading, because it filters out a lot of volume. This indicator locks the obv at 5 minutes, giving more information about the total amount of added and subtracted volume.
Script protetto
Questo script è pubblicato come codice protetto. Tuttavia, è possibile utilizzarle liberamente e senza alcuna limitazione – ulteriori informazioni qui.
Declinazione di responsabilità
Le informazioni e le pubblicazioni non sono intese come, e non costituiscono, consulenza o raccomandazioni finanziarie, di investimento, di trading o di altro tipo fornite o approvate da TradingView. Per ulteriori informazioni, consultare i Termini di utilizzo.