CUO WITH BLUE BULL
//
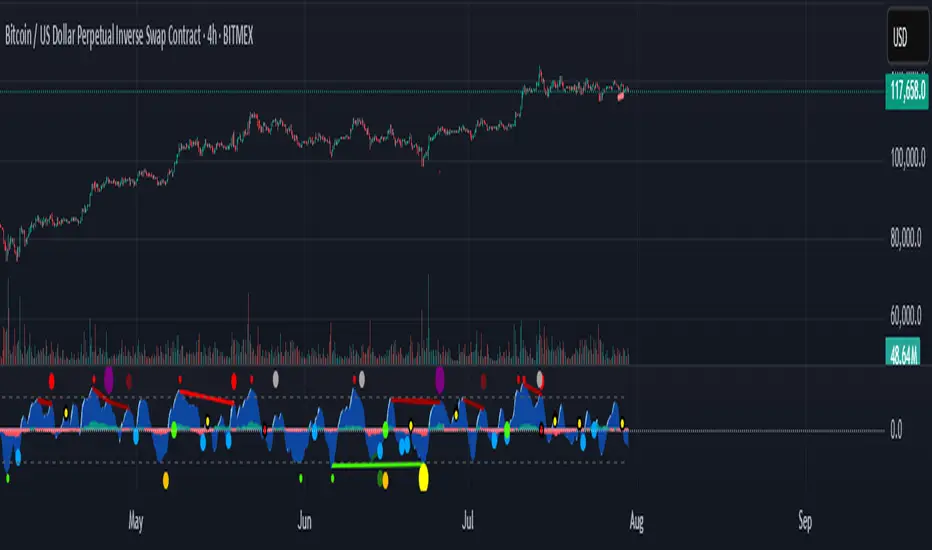
// The Core Ultra Oscillator (CUO) is a technical analysis tool designed to identify potential trend reversals and breakout opportunities by combining momentum, volume, and divergence analysis.
// It aims to enhance divergence-based trading by incorporating additional filters to reduce false signals during strong market trends.
// The indicator integrates WaveTrend Oscillator, regular volume and Cumulative Volume Delta (CVD), generating unique divergence signals enhanced with trend filters to allow greater flexibility in trading style and market type.
//
// Key Features:
// - WaveTrend Oscillator: Plots momentum with customizable overbought and oversold levels, displaying buy (green dots) and sell (red dots) signals for prints in extreme zones.
// - Divergence Detection: Identifies regular and hidden bullish/bearish divergences on WaveTrend and CVD, using green/red lines to connect fractal points for potential trend reversals.
// - Cumulative Volume Delta (CVD): Measures buying and selling pressure with smoothed, normalized delta, enhanced by trend and slope filters for signal reliability.
// - Trend Shift Dots:
// - Green White Dot: Indicates the end of a bearish CVD trend, suggesting a potential bullish shift.
// - Black Dot (Red Center): Signals the end of a bullish CVD trend, indicating a potential bearish shift.
// - Seven Unique Dot Signals:
// - Blue Dot (Blue Bull): Highlights potential bullish breakouts based on accumulated momentum.
// - Yellow Dot (Gold Extreme Buy): Marks potential buying opportunities near market bottoms, often following an amber dot.
// - Purple Dot (Extreme Sell): Identifies high-probability sell signals using divergence and trend weakness filters.
// - Black Dot (Yellow Center): Targets first sign of weakness after a strong bullish trend ends, aiming to capture significant selloffs.
// - Dark Blue Dot: Signals peaks in oversold regions after a bullish trend has ended and momentum has flipped towards the bears.
// - Dark Grey Dot: Warns of potential tops via CVD bearish divergences, ideally confirmed with Purple Dot or regular divergences.
// - Amber Dot: Indicates potential bottoms via CVD bullish divergences, to be confirmed with Yellow Dot or regular divergences.
// - Comprehensive Alerts: Includes 15 alert conditions for WaveTrend, CVD, and dot signals to support real-time trading decisions.
//
// How to Use:
// - Apply the indicator to any chart to monitor momentum, volume, and divergences.
// - Adjust Trend momentum, WaveTrend, CVD, and trend thinning parameters through input settings.
// - Use dot signals and divergence lines to time trade entries and exits.
// - Configure alerts for real-time notifications of key signals.
//
// Note: This indicator is for informational purposes only and does not constitute financial advice. Users are encouraged to backtest thoroughly and evaluate the indicator’s performance in their trading strategy.
Script su invito
Solo gli utenti approvati dall'autore possono accedere a questo script. È necessario richiedere e ottenere l'autorizzazione per utilizzarlo. Tale autorizzazione viene solitamente concessa dopo il pagamento. Per ulteriori dettagli, seguire le istruzioni dell'autore riportate di seguito o contattare direttamente GreenIce_Firefall.
TradingView NON consiglia di acquistare o utilizzare uno script a meno che non si abbia piena fiducia nel suo autore e se ne comprenda il funzionamento. È inoltre possibile trovare alternative gratuite e open source nei nostri script della community.
Istruzioni dell'autore
Declinazione di responsabilità
Script su invito
Solo gli utenti approvati dall'autore possono accedere a questo script. È necessario richiedere e ottenere l'autorizzazione per utilizzarlo. Tale autorizzazione viene solitamente concessa dopo il pagamento. Per ulteriori dettagli, seguire le istruzioni dell'autore riportate di seguito o contattare direttamente GreenIce_Firefall.
TradingView NON consiglia di acquistare o utilizzare uno script a meno che non si abbia piena fiducia nel suo autore e se ne comprenda il funzionamento. È inoltre possibile trovare alternative gratuite e open source nei nostri script della community.