Dynamic VWAP Web
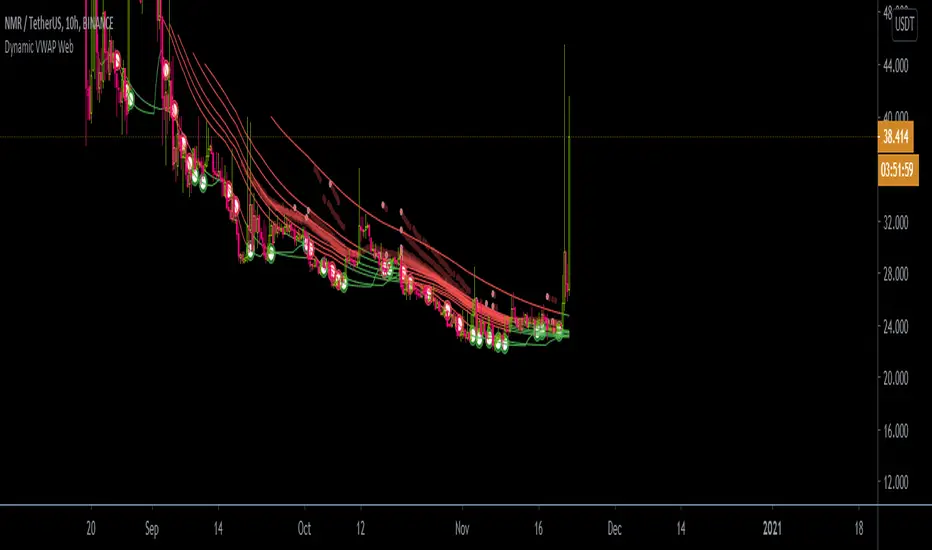
This indicator is built from my Bonfire system and includes VWAP , linear regression , and moving averages combined with dynamic lengths to show key trends, a moving profile, fractal patterns, and data visuals. The VWAP portion of the script is weighed a bit more and automated recognitions provide tons of pattern data and a moving profile that sharply interacts with the price on all levels. *dynamic lengths = lengths change when specific criteria has been met. This is opposed to the default, static or constant length inputs that stay the same unless changed manually.
Things to look for and questions to ask yourself:
a: How is the structure of the indicators flowing? Are the indicators collecting, pinching together, and smoothing out to provide a unanimous direction? How is the price reacting to the indicators? Is the price above, below all, most, or some of the indicators? (MARKED WITH LARGE DRAWN ELLIPSES)
b: What is your interpretation of the deviation between the indicators and the price? Is there a big spread? Is the price seemingly spiking or dropping to touch or grab certain indicator levels briefly while there is still a big spread between unorganized indicators? This can lead to a temporary pivot that does not sustain a long term bear or bull trend.
c: Is the price just above or below the indicators? Does the current trajectory and volume project a break upward, pushing the price through and over the indicators. Is the price bouncing off the lines as live resistance or support? Time is the most powerful force to recon with. The trajectory of the price towards the indicators vs the candle countdown can assist you in predicting if the price will be forced to cross above or below the profile indicators. When price crosses above a collected group of indicators , it's to be considered a bullish move. Likewise, when the price breaks downward on levels it would be considered a time to limit exposure.
d: Notice the difference in the thicker gradient lines above or below the price and more importantly, the absence of these lines compared to the current state of the other indicators. (MARKED WITH DRAWN DARK SHADED BOXES). Are the thick profile lines darker or lighter? Are these lines making sharp moves up or down well below the current price?
e: Keep note of each detail of the signals provided. The smaller green and red dots consistently appear along the (gradient) moving profile levels during specific price interactions with VWAP linear moving profile lines. Though these dots provide minor changes, it's still worth noting for consistent pattern recognition.
f: The built-in red and green rings signal when the price highs and lows breach or interrupt the linear/MA indicator lines. Often these appear in a pattern before and after a bigger move in price. Each asset or stock will have a different pattern or story to tell at different intervals. It is critical that you take the time to look at the patterns at different cycles and learn how to read the overall health of the price compared to the data and historical patterns provided.
g: The gradients fade and darken based on strength.
This is a new way to visualize the current state of an asset. Therefore it will take some time to learn the nuances of Dynamic VWAP WEB. Devote some time to learn the patterns that align with your goals and timeframes.
This is a pay for use indicator. Please message me for access through Tradingview messages.
Payment = Contact for details . A one time fee via cryptocurrency ( BTC ,ETH,LTC, DGB ) preferred.
Script su invito
Solo gli utenti approvati dall'autore possono accedere a questo script. È necessario richiedere e ottenere l'autorizzazione per utilizzarlo. Tale autorizzazione viene solitamente concessa dopo il pagamento. Per ulteriori dettagli, seguire le istruzioni dell'autore riportate di seguito o contattare direttamente CaptBlackBeard.
TradingView NON consiglia di acquistare o utilizzare uno script a meno che non si abbia piena fiducia nel suo autore e se ne comprenda il funzionamento. È inoltre possibile trovare alternative gratuite e open source nei nostri script della community.
Istruzioni dell'autore
Declinazione di responsabilità
Script su invito
Solo gli utenti approvati dall'autore possono accedere a questo script. È necessario richiedere e ottenere l'autorizzazione per utilizzarlo. Tale autorizzazione viene solitamente concessa dopo il pagamento. Per ulteriori dettagli, seguire le istruzioni dell'autore riportate di seguito o contattare direttamente CaptBlackBeard.
TradingView NON consiglia di acquistare o utilizzare uno script a meno che non si abbia piena fiducia nel suo autore e se ne comprenda il funzionamento. È inoltre possibile trovare alternative gratuite e open source nei nostri script della community.