OPEN-SOURCE SCRIPT
Trend and Entry CCI ST15
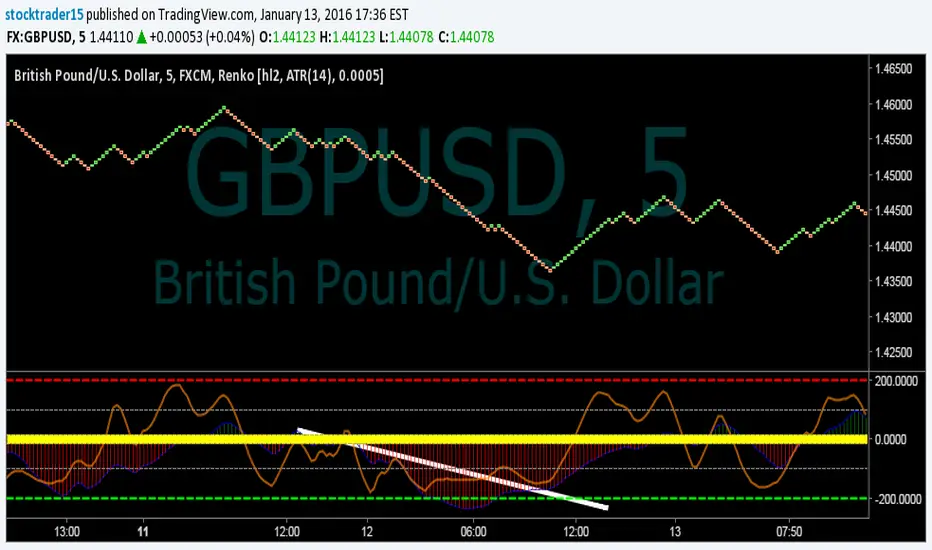
This is a T3 CCI with a fast and slow line as well as extreme lines, a -15,15 filter to make zero line rejections and crosses more mechanical and help weed out whipsaw. I will probably update description in the future and get into more detail about how the indicator is used but for now if you want more info look up woodie CCI patterns :) Good Luck!!
Script open-source
Nello spirito di TradingView, l'autore di questo script lo ha reso open source, in modo che i trader possano esaminarne e verificarne la funzionalità. Complimenti all'autore! Sebbene sia possibile utilizzarlo gratuitamente, ricordiamo che la ripubblicazione del codice è soggetta al nostro Regolamento.
Declinazione di responsabilità
Le informazioni e le pubblicazioni non sono intese come, e non costituiscono, consulenza o raccomandazioni finanziarie, di investimento, di trading o di altro tipo fornite o approvate da TradingView. Per ulteriori informazioni, consultare i Termini di utilizzo.