OPEN-SOURCE SCRIPT
Aggiornato Speculation Ratio Territory
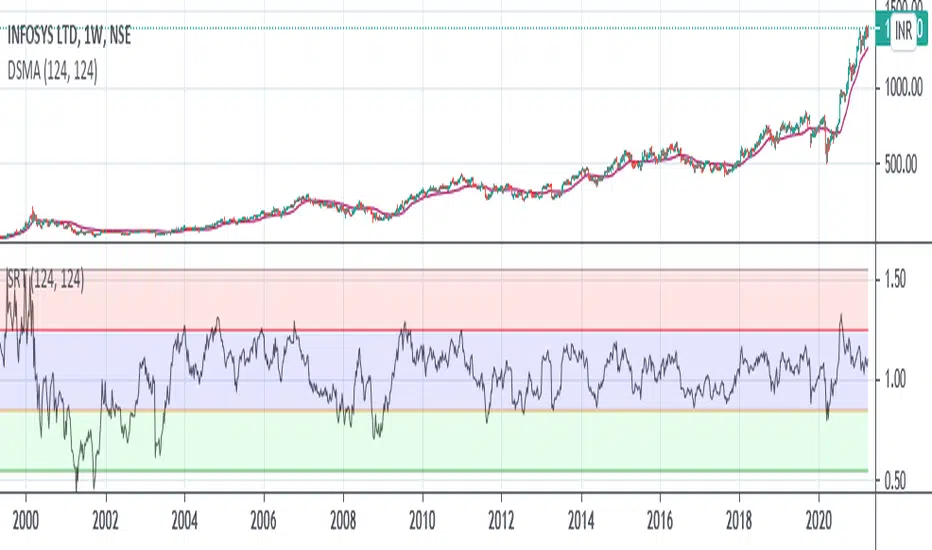
Speculation Ratio Territory
It is used to find the Index Top or Bottom which will define the buying and selling zone.
It should be checked on a weekly chart.
Example : As Nifty Trades around 248 days in a year.
So, 248/2 = 124
Now Use 124 DSMA on weekly chart.
Suppose Nifty 124 DSMA is @16000 and Current Market Price is 16500, then
SRT = 16500/16000 = 1.031
Top SRT of Nifty = 1.55
Bottom SRT of Nifty = 0.55
One should start investing when SRT value is between 0.55 to 0.75
And exit when SRT value is between 1.30 to 1.55
Credit for DSMA Script : //Deviation Scaled Moving Average by John Ehlers
It is used to find the Index Top or Bottom which will define the buying and selling zone.
It should be checked on a weekly chart.
Example : As Nifty Trades around 248 days in a year.
So, 248/2 = 124
Now Use 124 DSMA on weekly chart.
Suppose Nifty 124 DSMA is @16000 and Current Market Price is 16500, then
SRT = 16500/16000 = 1.031
Top SRT of Nifty = 1.55
Bottom SRT of Nifty = 0.55
One should start investing when SRT value is between 0.55 to 0.75
And exit when SRT value is between 1.30 to 1.55
- 0.55 to 0.75 --> ENTER (Green Zone)
- 0.75 to 1.30 --> HOLD (Blue Zone)
- 1.30 to 1.55 --> EXIT (Red Zone)
Credit for DSMA Script : //Deviation Scaled Moving Average by John Ehlers
Note di rilascio
Update : The concept of SRT is inspired by nkstocktalk , you can find the SRT details here as well : twitter.com"/"NKStockTalk1"/"status"/"1378537449010327553Script open-source
Nello spirito di TradingView, l'autore di questo script lo ha reso open source, in modo che i trader possano esaminarne e verificarne la funzionalità. Complimenti all'autore! Sebbene sia possibile utilizzarlo gratuitamente, ricordiamo che la ripubblicazione del codice è soggetta al nostro Regolamento.
Declinazione di responsabilità
Le informazioni e le pubblicazioni non sono intese come, e non costituiscono, consulenza o raccomandazioni finanziarie, di investimento, di trading o di altro tipo fornite o approvate da TradingView. Per ulteriori informazioni, consultare i Termini di utilizzo.
Script open-source
Nello spirito di TradingView, l'autore di questo script lo ha reso open source, in modo che i trader possano esaminarne e verificarne la funzionalità. Complimenti all'autore! Sebbene sia possibile utilizzarlo gratuitamente, ricordiamo che la ripubblicazione del codice è soggetta al nostro Regolamento.
Declinazione di responsabilità
Le informazioni e le pubblicazioni non sono intese come, e non costituiscono, consulenza o raccomandazioni finanziarie, di investimento, di trading o di altro tipo fornite o approvate da TradingView. Per ulteriori informazioni, consultare i Termini di utilizzo.