PROTECTED SOURCE SCRIPT
Adaptive RSI Divergence Pointer

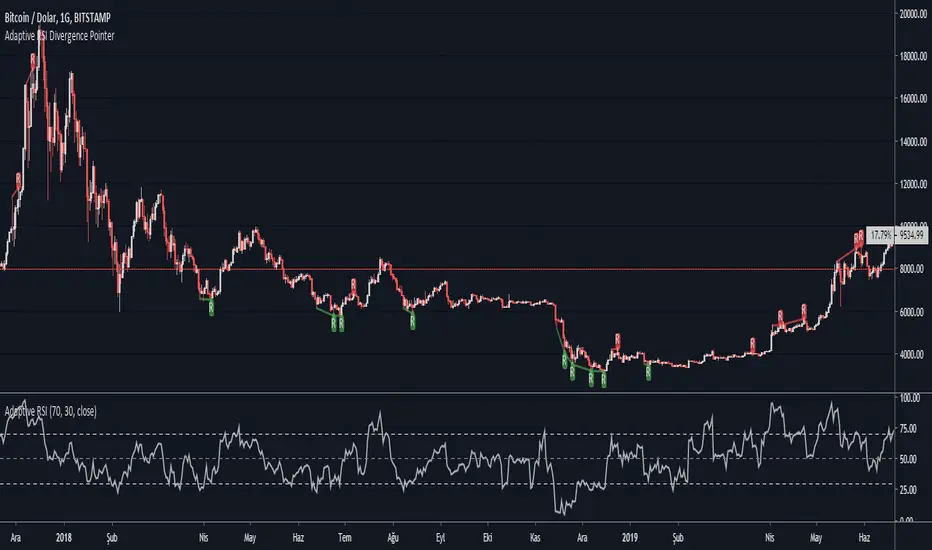
This script points regular and optionally hidden types of bullish and bearish Adaptive RSI divergences on the chart by drawing the divergence lines and optionally labels.
Hidden divergence is disabled by default, it can be enabled over settings window.
Regular divergence is enabled by default, it can be disabled over settings window.
There is an option to display the price channel additionally.
Added alerts for all types of divergences.
What is Adaptive RSI :
This is an implementation of John Ehlers’ Adaptive RSI , as described in his book Rocket Science for Traders: Digital Signal Processing Applications (2001-07-20).
It does not need a length value to be specified by user. It adopts itself perfectly to the price chart.
It integrates the idea of automatically determining the Dominant price cycle through a Homo-dyne Discriminator, and using half of a cycle length as the input for the RSI . Not only determines the most effective range for the RSI by setting it based on the cycle, but also makes the RSI PDF (Probability Distribution Function) adjustable as shown in John Ehler's papers.
Works just like a normal RSI , but should have less false signals.
Script protetto
Questo script è pubblicato come codice protetto. Tuttavia, è possibile utilizzarle liberamente e senza alcuna limitazione – ulteriori informazioni qui.
Declinazione di responsabilità
Le informazioni e le pubblicazioni non sono intese come, e non costituiscono, consulenza o raccomandazioni finanziarie, di investimento, di trading o di altro tipo fornite o approvate da TradingView. Per ulteriori informazioni, consultare i Termini di utilizzo.