OPEN-SOURCE SCRIPT
Aggiornato Buy & Sell Volume (OWI)
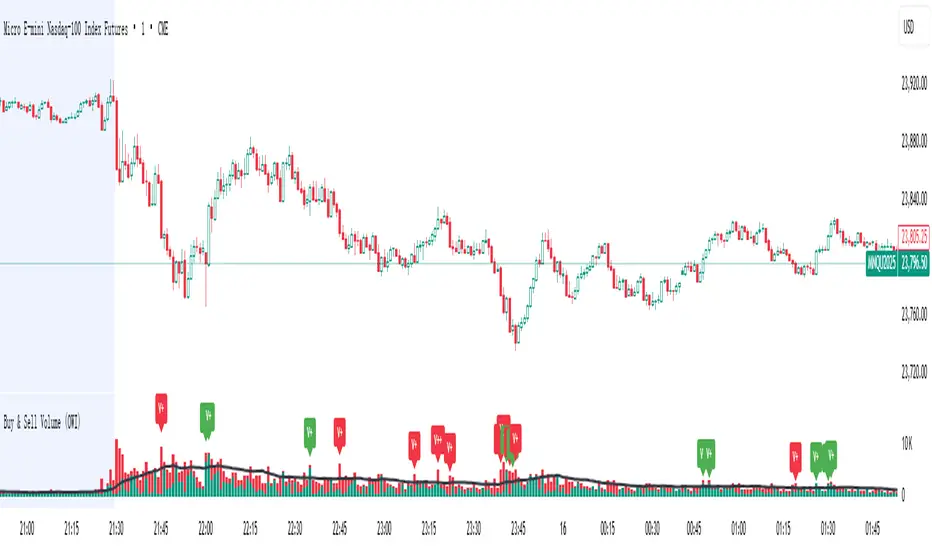
📊 Buy & Sell Volume (OWI) Indicator Guide
The Buy & Sell Volume (OWI) indicator is designed to provide a visual breakdown of buying and selling pressure in each candle, helping traders identify volume surges and potential market moves. It also includes a time filter to focus analysis during key trading hours.
⚙️ Setup & Inputs
When adding the indicator to your chart, you'll see several configurable inputs:
📈 How It Works
🔍 Volume Breakdown
⏰ Time Filter (Optional)
When enabled, the indicator only highlights volume spikes during the specified US market hours. This helps filter out noise from pre-market or after-hours trading.
🚨 Highlight Conditions
The indicator flags significant volume spikes with labels above the volume bars:
| Label | Condition |
| V+ | Volume is between 1.5× and 2× the SMA, during market hours (if enabled). |
| V++ | Volume exceeds 2× the SMA, during market hours (if enabled). |
💡 Tips
- Use shorter SMA lengths for more reactive volume analysis.
- Change the time filter if you're trading outside US market hours.
- Combine with candlestick patttern to confirm breakout or reversal signals.
The Buy & Sell Volume (OWI) indicator is designed to provide a visual breakdown of buying and selling pressure in each candle, helping traders identify volume surges and potential market moves. It also includes a time filter to focus analysis during key trading hours.
⚙️ Setup & Inputs
When adding the indicator to your chart, you'll see several configurable inputs:
- SMA Length : Sets the period for the Simple Moving Average (SMA) of total volume.
- Enable Time Filter : Toggles whether to restrict analysis to US market hours (Eastern Time). |
- Start Hour/Minute : Defines the beginning of the time filter window (default: 9:45 ET). |
- End Hour/Minute : Defines the end of the time filter window (default: 16:15 ET). |
📈 How It Works
🔍 Volume Breakdown
- Buy Volume: Estimated volume attributed to buyers, calculated based on candle position.
- Sell Volume: Estimated volume attributed to sellers.
- Total Volume SMA: A moving average of total volume to benchmark current activity.
⏰ Time Filter (Optional)
When enabled, the indicator only highlights volume spikes during the specified US market hours. This helps filter out noise from pre-market or after-hours trading.
🚨 Highlight Conditions
The indicator flags significant volume spikes with labels above the volume bars:
| Label | Condition |
| V+ | Volume is between 1.5× and 2× the SMA, during market hours (if enabled). |
| V++ | Volume exceeds 2× the SMA, during market hours (if enabled). |
💡 Tips
- Use shorter SMA lengths for more reactive volume analysis.
- Change the time filter if you're trading outside US market hours.
- Combine with candlestick patttern to confirm breakout or reversal signals.
Note di rilascio
Update Note for 'Previous Day High/Low Levels [OWI]'The Buy & Sell Volume (OWI) indicator is a custom volume analysis tool designed for intraday traders seeking to identify volume spikes and momentum-driven entry points. Unlike traditional volume indicators that treat all volume equally, OWI breaks down volume into buy-side and sell-side components, offering a more nuanced view of market participation. It also incorporates time-based filtering to focus analysis during US market hours, where liquidity and volatility are typically highest.
🧠 What Makes This Script Original?
- Decomposes volume into buy-side and sell-side using candle structure (high, low, close).
- Uses dynamic labeling to highlight volume spikes with directional bias.
- Includes time-based filtering to focus analysis during desirable market hours (US market by default).
⚙️ What It Does
- Calculates buy and sell volume based on where the close lies within the candle’s range.
- Compares current volume to a 20 SMA to detect volume spikes.
- Flags spikes with “V+” (1.5–2x SMA) and “V++” (>2x SMA) labels.
- Labels are color-coded: green for buy-dominant, red for sell-dominant.
- Plots total volume, buy volume, and volume SMA for visual clarity.
🧭 How to Use It
- Use “V+” and “V++” volume spike labels as contextual signals, not standalone trade triggers.
- Look for confluence with opening range breaks—volume spikes during a breakout of the first 15–30 minutes can confirm conviction
- Watch for low-volume retests after a spike; this often signals absorption and continuation.
- Combine volume signals with candlestick patterns (e.g., engulfing, pin bars) to refine entries.
Example 1 : Breakout buy in NQ with volume spike. (1.5x SMA)
Example 2 : Break & retest buy in NQ with low volume
Example 3 : Reversal play on NQ. Low volume when retesting FVG => Serve as iFVG support zone
The real edge comes from layering volume analysis with price structure, liquidity zones, and market timing.
Note di rilascio
Chart UpdateScript open-source
Nello spirito di TradingView, l'autore di questo script lo ha reso open source, in modo che i trader possano esaminarne e verificarne la funzionalità. Complimenti all'autore! Sebbene sia possibile utilizzarlo gratuitamente, ricordiamo che la ripubblicazione del codice è soggetta al nostro Regolamento.
Declinazione di responsabilità
Le informazioni e le pubblicazioni non sono intese come, e non costituiscono, consulenza o raccomandazioni finanziarie, di investimento, di trading o di altro tipo fornite o approvate da TradingView. Per ulteriori informazioni, consultare i Termini di utilizzo.
Script open-source
Nello spirito di TradingView, l'autore di questo script lo ha reso open source, in modo che i trader possano esaminarne e verificarne la funzionalità. Complimenti all'autore! Sebbene sia possibile utilizzarlo gratuitamente, ricordiamo che la ripubblicazione del codice è soggetta al nostro Regolamento.
Declinazione di responsabilità
Le informazioni e le pubblicazioni non sono intese come, e non costituiscono, consulenza o raccomandazioni finanziarie, di investimento, di trading o di altro tipo fornite o approvate da TradingView. Per ulteriori informazioni, consultare i Termini di utilizzo.