OPEN-SOURCE SCRIPT
Extended Support and Resistance Levels

Indicator: Extended Support and Resistance Levels
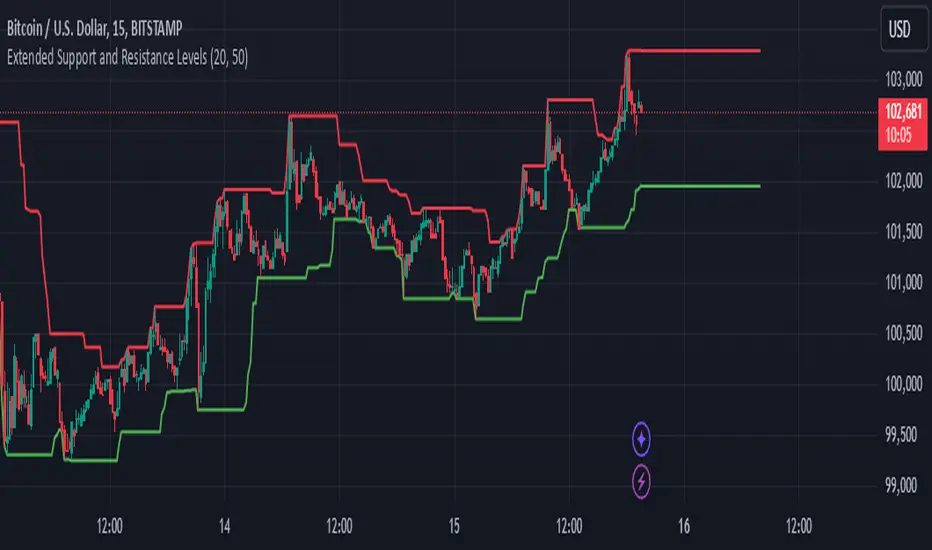
This Pine Script indicator dynamically calculates support and resistance levels based on recent price action and projects these levels into the future.
Support is determined by the lowest low over a user-defined period, while Resistance is defined by the highest high over the same period.
The indicator draws lines at the calculated support and resistance levels and extends them into the future, allowing traders to visualize potential future levels where price might react.
The extension of these lines helps in identifying areas where price may respect support or resistance in the upcoming bars.
The user can adjust the period for support/resistance calculation and the number of bars for projection, providing flexibility to adapt to different timeframes and market conditions.
This tool is ideal for traders looking to anticipate future key price levels based on historical price data, helping with decision-making on potential entry or exit points.
Script open-source
Nello spirito di TradingView, l'autore di questo script lo ha reso open source, in modo che i trader possano esaminarne e verificarne la funzionalità. Complimenti all'autore! Sebbene sia possibile utilizzarlo gratuitamente, ricordiamo che la ripubblicazione del codice è soggetta al nostro Regolamento.
Declinazione di responsabilità
Le informazioni e le pubblicazioni non sono intese come, e non costituiscono, consulenza o raccomandazioni finanziarie, di investimento, di trading o di altro tipo fornite o approvate da TradingView. Per ulteriori informazioni, consultare i Termini di utilizzo.