DX24

Class: scalpel hybrid
Period: 5 minutes – 15 minutes
Designed for short-term intraday trading.
The indicator consists of three blocks: level-block, trend-block and statistical-block.
The level block is used to determine the entry points, as well as the basic parameters of the trade (stop loss and take profit).
The trend block is used to determine the priority direction of the trade.
The statistical block is used to provide additional information to the two base blocks.
Level block
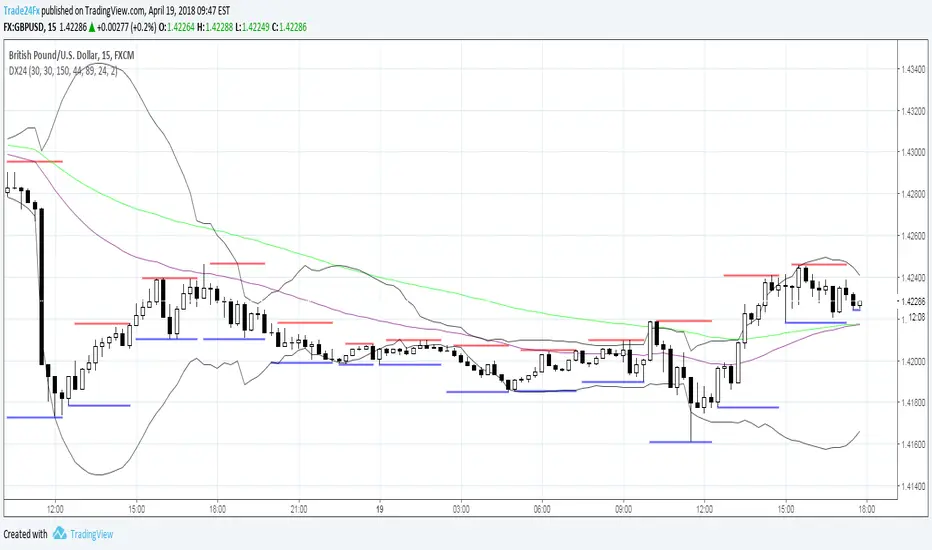
Consists of dynamic support (blue lines) and resistance (red lines) levels. Accordingly, near these lines positions should be opened: the long ones from support lines and short ones from resistance lines.
Trend block
Contains two exponentially weighted moving averages (EMA based on close prices): slow (default period = 89) and fast (default period = 44).
The purpose of this block is to ensure that trade is in the trend. That is, only trades in the direction of BOTH EMAs are allowed.
Statistical block
Contains a modified version of the classical indicator Bollinger Bands and allows to determine the maximum upper bounds of the current movement and the minimum lower ones. On the graph it is represented by black lines of the dynamic channel. The behavior of these lines can determine the current state of the market - the narrowing of lines - a signal for more aggressive trading, expansion - a signal of a surge in volatility and an reason for more conservative trading. The coincidence of the level lines with the lines of the dynamic channel is an confirmatory signal, that is, the probability of a correct entry into the position in this case significantly increases.
Trading rules
This version of the indicator is designed for intraday scalping trade and should be used on charts from 5 min to 15 min intervals.
The general rules of trade are as follows:
- EMAs indicate the permitted direction of transactions (both averages should be unidirectional and transactions are allowed only in this direction. For example, if both averages grow, you can only buy and vice versa).
- sell from the red line (take-profit is located in the area of the blue line; the stops are respectively above the red line);
- buy from blue line (take-profit is located in the area of the red lines, stop respectively below the blue line).
Script su invito
Solo gli utenti approvati dall'autore possono accedere a questo script. È necessario richiedere e ottenere l'autorizzazione per utilizzarlo. Tale autorizzazione viene solitamente concessa dopo il pagamento. Per ulteriori dettagli, seguire le istruzioni dell'autore riportate di seguito o contattare direttamente Trade24Fx.
TradingView NON consiglia di acquistare o utilizzare uno script a meno che non si abbia piena fiducia nel suo autore e se ne comprenda il funzionamento. È inoltre possibile trovare alternative gratuite e open source nei nostri script della community.
Istruzioni dell'autore
bit.ly/2oBvkHY
Больше информации на нашем ютьюб-канале
youtube.com/channel/UCYEOurJfasXWyYnrriGwsqQ
Declinazione di responsabilità
Script su invito
Solo gli utenti approvati dall'autore possono accedere a questo script. È necessario richiedere e ottenere l'autorizzazione per utilizzarlo. Tale autorizzazione viene solitamente concessa dopo il pagamento. Per ulteriori dettagli, seguire le istruzioni dell'autore riportate di seguito o contattare direttamente Trade24Fx.
TradingView NON consiglia di acquistare o utilizzare uno script a meno che non si abbia piena fiducia nel suo autore e se ne comprenda il funzionamento. È inoltre possibile trovare alternative gratuite e open source nei nostri script della community.
Istruzioni dell'autore
bit.ly/2oBvkHY
Больше информации на нашем ютьюб-канале
youtube.com/channel/UCYEOurJfasXWyYnrriGwsqQ