OPEN-SOURCE SCRIPT
Aggiornato Countdown & Candle Recap Dashboard
This script provides a compact dashboard showing a countdown timer and a recap of the previous candles. Ideal for traders who want to monitor short-term price action and candle behavior across different timeframes.
Features: • Countdown display for current candle • Summary of previous candles (PrevCndl1, PrevCndl2) • TimeFrame Recap section for quick analysis
Designed for scalpers, intraday traders, and anyone who values precision timing and candle structure.
Features: • Countdown display for current candle • Summary of previous candles (PrevCndl1, PrevCndl2) • TimeFrame Recap section for quick analysis
Designed for scalpers, intraday traders, and anyone who values precision timing and candle structure.
Note di rilascio
📘 Script Description — TimeFrame RecapTimeFrame Recap is a compact, multi-timeframe dashboard designed for scalpers and intraday traders who want a quick visual summary of recent candle behavior across key timeframes.
This script displays:
✅ Countdown Timer for the current candle on each selected timeframe
✅ Trend Direction of the current candle (🟢 bullish / 🔴 bearish / – neutral)
✅ Previous Candle Summary up to 5 historical candles per timeframe, shown as emojis for fast interpretation
Features:
🔹 Select from 5 timeframes: M05, M15, H01, H04, D01
🔹 Choose how many previous candles to display (2 to 5)
🔹 No limit on how many timeframes you can enable
🔹 Optimized to stay within Pine Script’s security call limits
Use Case: Ideal for scalpers who want to confirm momentum across multiple timeframes before entering a trade. The emoji-based display makes it easy to spot consistent bullish or bearish pressure at a glance.
Note di rilascio
📘 Script Description — TimeFrame RecapTimeFrame Recap is a compact and dynamic table that summarizes recent candle behavior across multiple timeframes. Designed for scalpers and multi-timeframe analysts, this tool provides:
⏱ Countdown Timer: Displays the time remaining until the next candle closes for each selected timeframe.
📊 Trend Indicator: Uses intuitive emojis (🟢 bullish, 🔴 bearish, ➖ neutral) to show the current candle direction.
🕯 Previous Candle Summary: Shows up to 5 previous candles per timeframe, with visual cues for quick trend recognition.
You can customize:
✅ Which timeframes to display (M05, M15, H01, H04, D01)
✅ How many previous candles to include (2–5)
The table updates in real time and appears in the top-right corner of your chart. It’s optimized for clarity, speed, and decision-making at a glance.
Note di rilascio
📘 Script Description: TimeFrame Recap (TFR)TimeFrame Recap (TFR) is a compact, multi-timeframe dashboard designed for scalpers and intraday traders who want a quick visual summary of recent candle behavior across key timeframes.
This script displays:
✅ A configurable history of previous candles (up to 5) for each selected timeframe
✅ Bullish, bearish, or neutral candle direction using intuitive emoji cues (🟢 🔴 ✝️ ⚪)
✅ A real-time countdown until the next candle closes
✅ A trend snapshot of the current candle direction per timeframe
You can toggle which timeframes to display (M01, M05, M15, H01, H04), and the table updates dynamically at the top-right of your chart. The emoji logic makes it easy to scan for momentum shifts, reversals, or indecision zones.
Perfect for scalpers who want to stay synchronized across multiple timeframes without cluttering their chart.
Note di rilascio
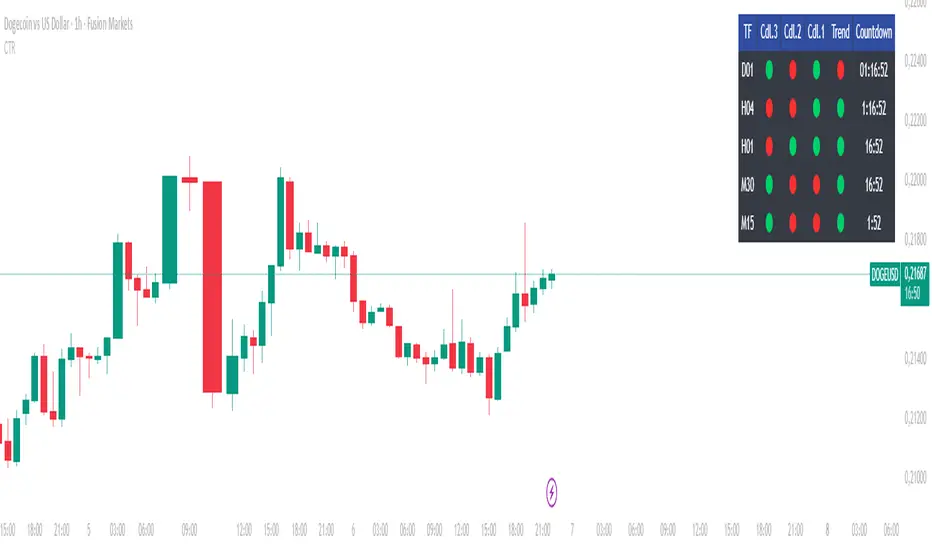
🕒 Candle TimeFrame Recap (CTR) — Script OverviewThis Pine Script is designed for TradingView and provides a visual summary of recent candle data across multiple timeframes, along with a countdown timer for the current candle. It displays this information in a compact table format directly on the chart.
🔧 Key Features
Multi-Timeframe Support: Allows users to select which timeframes to display (Daily, 4H, 1H, 30min, 15min).
Candle History Recap: Shows the bullish/bearish nature of the last few candles (up to 5) for each selected timeframe.
Countdown Timer: Displays the remaining time until the current candle closes.
Trend Indicator: Uses emojis to represent the current candle's direction:
🟢 Bullish
🔴 Bearish
✝️ Neutral
⚪ Undefined
📥 User Inputs
Toggle switches to show/hide each timeframe.
Adjustable number of previous candles to display (between 2 and 5).
🧠 Core Logic
Data Retrieval: Uses request.security() to fetch candle data from different timeframes.
Trend Detection: Compares close vs open to determine candle direction.
Countdown Calculation: Computes time remaining until the current candle closes.
Emoji Mapping: Converts trend values into intuitive emoji symbols.
Table Construction:
First row: headers for timeframe, previous candles, trend, and countdown.
Subsequent rows: one per selected timeframe, showing candle history and countdown.
📊 Visual Output
The script creates a dynamic table positioned in the top-right corner of the chart. Each row corresponds to a selected timeframe and includes:
TF Cdl.5 Cdl.4 ... Trend Countdown
D01 🟢 🔴 ... 🟢 01:23:45
The table updates in real-time and only renders on the last bar to optimize performance.
Script open-source
Nello spirito di TradingView, l'autore di questo script lo ha reso open source, in modo che i trader possano esaminarne e verificarne la funzionalità. Complimenti all'autore! Sebbene sia possibile utilizzarlo gratuitamente, ricordiamo che la ripubblicazione del codice è soggetta al nostro Regolamento.
Declinazione di responsabilità
Le informazioni e le pubblicazioni non sono intese come, e non costituiscono, consulenza o raccomandazioni finanziarie, di investimento, di trading o di altro tipo fornite o approvate da TradingView. Per ulteriori informazioni, consultare i Termini di utilizzo.