PROTECTED SOURCE SCRIPT
Mean Reversion Probability
Mean Reversion Probability
Lookback Period (default 100): The number of candles used to calculate the average and standard deviation
Standard Deviation Multiplier (default 2.0): Determines how wide the bands are around the mean
Probability Band Length (default 20): Controls how far the probability calculations extend
Reading the Indicator
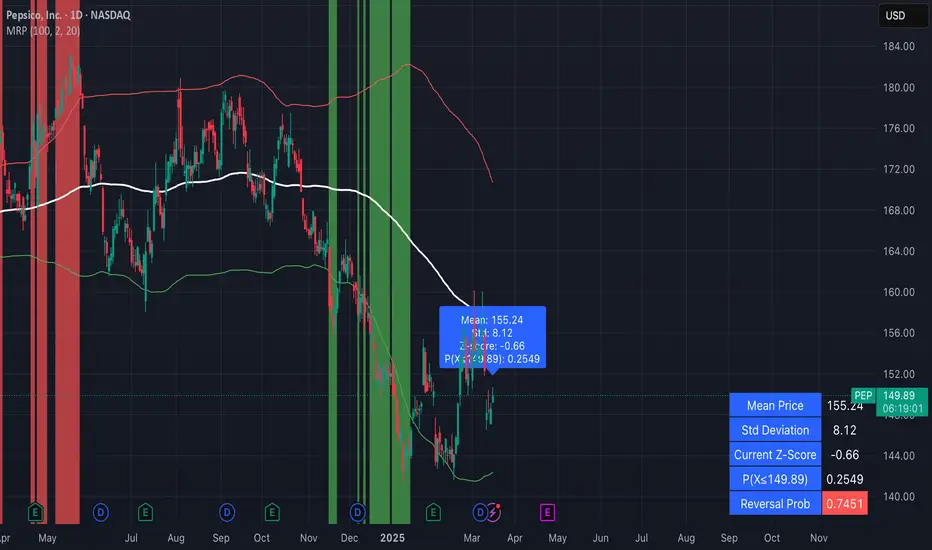
The indicator displays several key elements:
Mean Line (Blue): The average closing price over the lookback period
Upper/Lower Bands (Red/Green): Statistically significant deviation levels (similar to Bollinger Bands)
On-Chart Labels: Show real-time statistical measurements:
Mean price
Standard deviation
Z-score (how many standard deviations from the mean)
Probability calculations
"CORRECTION LIKELY" warning when appropriate
Background Color: Changes to red or green when prices reach extreme levels
Arrow Signals:
Red down arrows appear when price crosses above the upper band (potential reversal down)
Green up arrows appear when price crosses below the lower band (potential reversal up)
Information Table: Shows detailed probability statistics in the corner of your chart
Trading Strategies
Mean Reversion Strategy:
When price reaches the upper band (red background): Consider selling or taking profits
When price reaches the lower band (green background): Consider buying or adding positions
Probability-Based Trading:
Use the probability values to gauge the likelihood of a reversal
Higher reversion probability (>0.7) suggests stronger mean reversion potential
The Z-score tells you how extreme the current price is (values >2 or <-2 are statistically significant)
Combining with Other Indicators:
Use RSI or MACD to confirm overbought/oversold conditions
Use volume indicators to confirm potential reversals
Look for candlestick patterns at the band extremes for additional confirmation
Real-World Example
In your screenshot, you can see a similar analysis where:
The price was at 31.18
The standard deviation was 7.3
The probability calculation P(X≤18.87) was 0.0465
This low probability (4.65%) indicated that the price was statistically unlikely to fall below 18.87, suggesting a potential buying opportunity near that level.
Script protetto
Questo script è pubblicato come codice protetto. Tuttavia, è possibile utilizzarle liberamente e senza alcuna limitazione – ulteriori informazioni qui.
Declinazione di responsabilità
Le informazioni e le pubblicazioni non sono intese come, e non costituiscono, consulenza o raccomandazioni finanziarie, di investimento, di trading o di altro tipo fornite o approvate da TradingView. Per ulteriori informazioni, consultare i Termini di utilizzo.