OPEN-SOURCE SCRIPT
Solana – Daily Chart Analysis
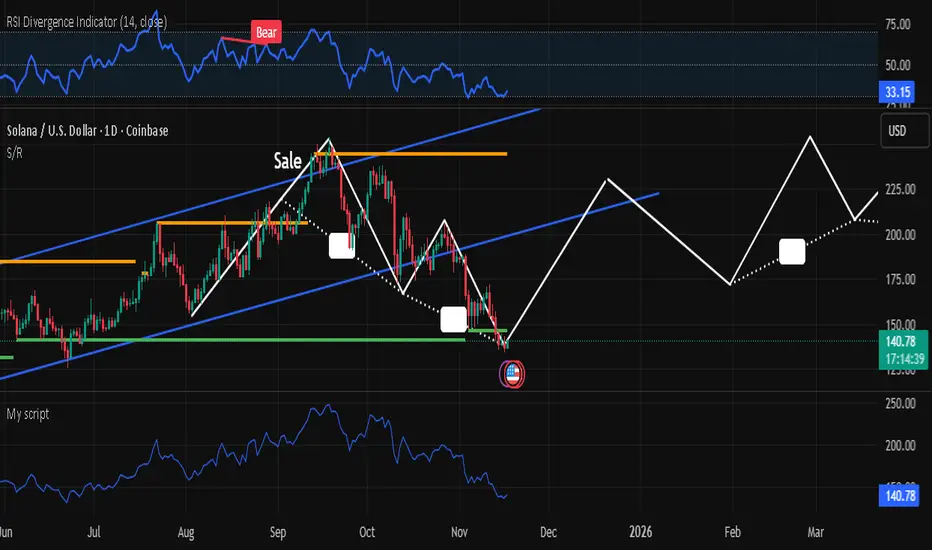
Solana is currently holding around $140 after a sharp correction from the upper channel resistance. Price is testing a key ascending trendline and horizontal support zone near $135.
📉 RSI at 32.76 signals oversold conditions, watch for potential bullish reversal setups.
🔮 Possible Path Ahead (White Projection):
• Bounce to $180 → Consolidation
• Breakout toward $240
• Target zone: $280–$300 by mid-2026
(based on channel re-entry and momentum recovery)
❗If support fails, next major demand zone sits around $100–$110.
📊 Watching closely for confirmation of trend reversal.
Script open-source
Nello spirito di TradingView, l'autore di questo script lo ha reso open source, in modo che i trader possano esaminarne e verificarne la funzionalità. Complimenti all'autore! Sebbene sia possibile utilizzarlo gratuitamente, ricordiamo che la ripubblicazione del codice è soggetta al nostro Regolamento.
Declinazione di responsabilità
Le informazioni e le pubblicazioni non sono intese come, e non costituiscono, consulenza o raccomandazioni finanziarie, di investimento, di trading o di altro tipo fornite o approvate da TradingView. Per ulteriori informazioni, consultare i Termini di utilizzo.