OPEN-SOURCE SCRIPT
Flunki TWAP minus MTF TWAP Oscillator
Heys,
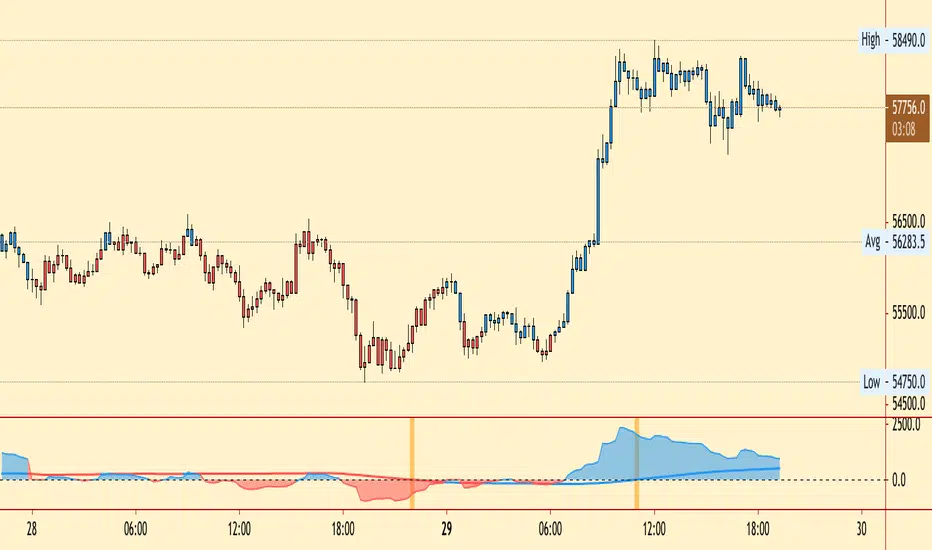
Herewith a another simple oscillator that show the difference in price between a selectable timeframe TWAP and another alternative selectable timeframe TWAP
This is shown as a histogram.
Use numeric TWAP values for minutes (30, 60 ,720 whatever) and D, 3D, W, M for higher values
There is also a global timeframe which will set the timeframe for a global alternate timeframe (instead of current chart resolution)
On top of that is a Moving Average of the histogram value, shown as a blue / red line with an option to highlight this MA crossing zero, and an option to colour bars to this line.
Simple idea : Code open
Enjoy !
Script open-source
Nello spirito di TradingView, l'autore di questo script lo ha reso open source, in modo che i trader possano esaminarne e verificarne la funzionalità. Complimenti all'autore! Sebbene sia possibile utilizzarlo gratuitamente, ricordiamo che la ripubblicazione del codice è soggetta al nostro Regolamento.
Declinazione di responsabilità
Le informazioni e le pubblicazioni non sono intese come, e non costituiscono, consulenza o raccomandazioni finanziarie, di investimento, di trading o di altro tipo fornite o approvate da TradingView. Per ulteriori informazioni, consultare i Termini di utilizzo.