OPEN-SOURCE SCRIPT
Madrid Donchian SEC bar
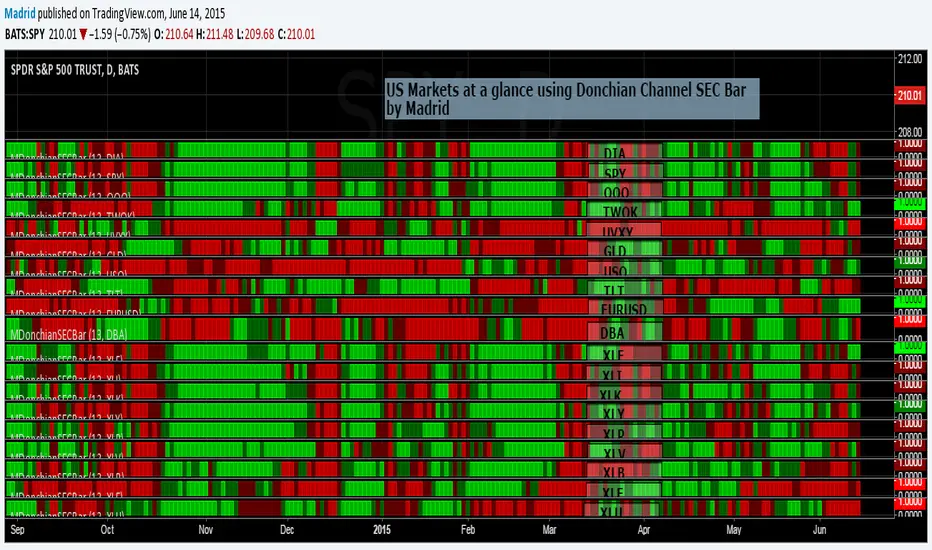
This study is based on the Donchain Channel Bar indicator but this adds security as a parameter. This allows several instances of this indicator to be used in the same page to create a heat map to take look at a glance at several securities, just like the example where this was implemented.
The only two parameters it requires are the security symbol and the length of the analysis.
The only two parameters it requires are the security symbol and the length of the analysis.
Script open-source
In pieno spirito TradingView, il creatore di questo script lo ha reso open-source, in modo che i trader possano esaminarlo e verificarne la funzionalità. Complimenti all'autore! Sebbene sia possibile utilizzarlo gratuitamente, ricorda che la ripubblicazione del codice è soggetta al nostro Regolamento.
Pubblicazioni correlate
Declinazione di responsabilità
Le informazioni ed i contenuti pubblicati non costituiscono in alcun modo una sollecitazione ad investire o ad operare nei mercati finanziari. Non sono inoltre fornite o supportate da TradingView. Maggiori dettagli nelle Condizioni d'uso.