PROTECTED SOURCE SCRIPT
Portfolio Dashboard by DTR
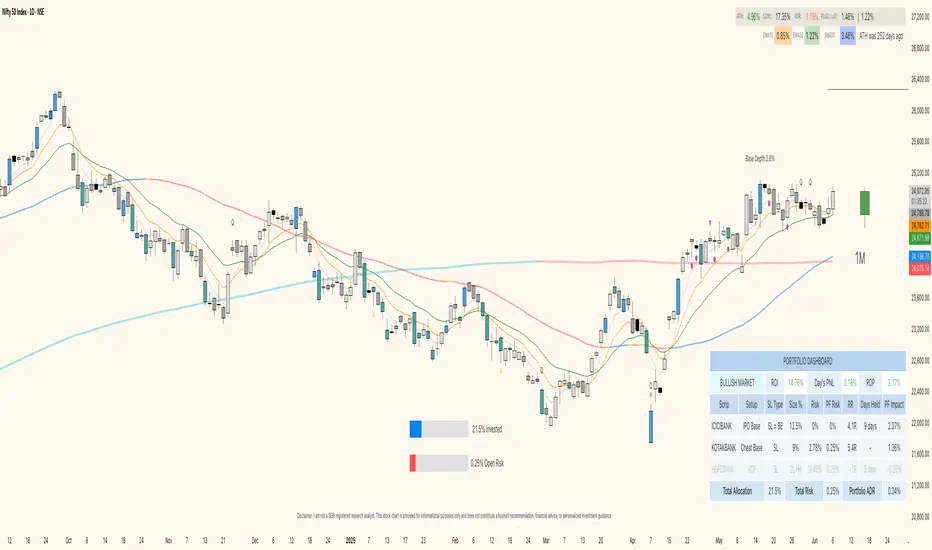
The Portfolio Dashboard by DTR is a sophisticated yet user-friendly Pine Script indicator for TradingView, designed to empower traders with a comprehensive tool for managing and monitoring investment portfolios. Supporting up to 10 stocks, it delivers real-time performance metrics, risk analysis, and market insights in an intuitive, customizable dashboard—perfect for traders of all experience levels.
Key Features
Real-Time Portfolio Metrics: Tracks Return on Investment (ROI), Day's Profit and Loss (PNL), Risk of Profit (ROP), and Average Daily Range (ADR) with color-coded indicators for quick insights.
Individual Stock Insights: Displays detailed data for each stock, including ticker, trading setup, Last Traded Price (LTP) or Stop Loss (SL) status, position size, risk, portfolio risk, Risk-Reward (RR) or Gain%, daily change%, portfolio impact, and optional ADR.
Market Condition Analysis: Evaluates broader market trends using NSE:CNXSMALLCAP data, categorizing conditions as CHOPPY, BULL MARKET, BEAR MARKET, SHAKEOUT, or BEAR RALLY with visual color cues.
Customization Options:
Input total capital (scalable in Thousands, Lacs, or Crores) and maximum risk percentage.
Choose from B&W, Blue, Green, Red, Purple, or Transparent themes, with Dark Mode support.
Adjust dashboard and gauge positions (top/middle/bottom, left/center/right) and text sizes (tiny to huge).
Toggle display options like LTP, % change color, total row, ADR column, RR/Gain%, and empty rows.
Risk Management Tools: Calculates position sizes, individual and portfolio-level risks, and offers visual gauges for total allocation (% invested) and open risk (% of max risk). Supports setting Stop Loss to Break-Even (SL=BE).
Chart Enhancements: Optionally displays entry and stop loss lines on the chart with customizable styles (Dashed, Dotted, Normal) and dynamic labels for precise trade management.
How It Works
Setup: Users input portfolio details—ticker symbols, quantities, entry prices, stop losses, exits, and setups—for up to 10 stocks, along with capital and risk settings.
Data Processing: The indicator fetches daily high, low, close, and previous close data to compute metrics like ADR, percentage change, and Day's PNL for each stock.
Visualization: On the last bar, it generates a detailed table summarizing portfolio and stock-level data, alongside two gauges for allocation and risk, positioned per user preferences.
Chart Integration: When enabled, entry and SL lines with labels appear on the chart for the current ticker, updating dynamically based on price action.
How to Use
Add to Chart: Apply the indicator to your TradingView chart.
Configure Settings: In the settings panel, enter your total capital, stock details, and customize themes, positions, and display preferences.
Monitor Portfolio: Use the dashboard to assess portfolio health, risk exposure, and market conditions in real time.
Manage Trades: Leverage chart lines and labels to execute and adjust trades with precision.
Benefits
Centralized Oversight: Consolidates all essential portfolio data into one view.
Enhanced Risk Control: Provides real-time risk metrics and visual tools for proactive management.
Flexible Design: Adapts to various trading strategies and aesthetic preferences.
Intuitive Interface: Combines detailed analytics with clear, visually appealing presentation.
Important Notes
Accuracy: Ensure correct ticker symbols (e.g., NSE:RELIANCE) and price inputs for reliable results.
Timeframes: Optimized for daily or intraday charts; updates occur on the last bar.
Dependencies: Market condition and ADR calculations rely on NSE:CNXSMALLCAP data availability.
Elevate your trading with the Portfolio Dashboard by DTR—a powerful, all-in-one solution for portfolio management on TradingView. Take control of your investments today!
Script protetto
Questo script è pubblicato come codice protetto. Tuttavia, è possibile utilizzarle liberamente e senza alcuna limitazione – ulteriori informazioni qui.
Declinazione di responsabilità
Le informazioni e le pubblicazioni non sono intese come, e non costituiscono, consulenza o raccomandazioni finanziarie, di investimento, di trading o di altro tipo fornite o approvate da TradingView. Per ulteriori informazioni, consultare i Termini di utilizzo.