OPEN-SOURCE SCRIPT
Liquidity Sweep Detector
The Liquidity Sweep Detector represents a technical analysis tool specifically designed to identify market microstructure patterns typically associated with institutional trading activity. According to Harris (2003), institutional traders frequently employ tactics where they momentarily break through price levels to trigger stop orders before redirecting the market in the opposite direction. This phenomenon, commonly referred to as "stop hunting" or "liquidity sweeping," constitutes a significant aspect of institutional order flow analysis (Osler, 2003). The current implementation provides retail traders with a means to identify these patterns, potentially aligning their trading decisions with institutional movements rather than becoming victims of such strategies.
Osler's (2003) research documents how stop-loss orders tend to cluster around significant price levels, creating concentrations of liquidity. Taylor (2005) argues that sophisticated institutional participants systematically exploit these liquidity clusters by inducing price movements that trigger these orders, subsequently profiting from the ensuing price reaction. The algorithmic detection of such patterns involves several key processes. First, the indicator identifies swing points—local maxima and minima—through comparison with historical price data within a definable lookback period. These swing points correspond to what Bulkowski (2011) describes as "significant pivot points" that frequently serve as liquidity zones where stop orders accumulate.
The core detection algorithm utilizes a multi-stage process to identify potential sweeps. For high sweeps, it monitors when price exceeds a previous swing high by a specified threshold percentage, followed by a bearish candle that closes below the original swing high level. Conversely, for low sweeps, it detects when price drops below a previous swing low by the threshold percentage, followed by a bullish candle closing above the original swing low. As noted by Lo and MacKinlay (2011), these price patterns often emerge when large institutional players attempt to capture liquidity before initiating significant directional moves.
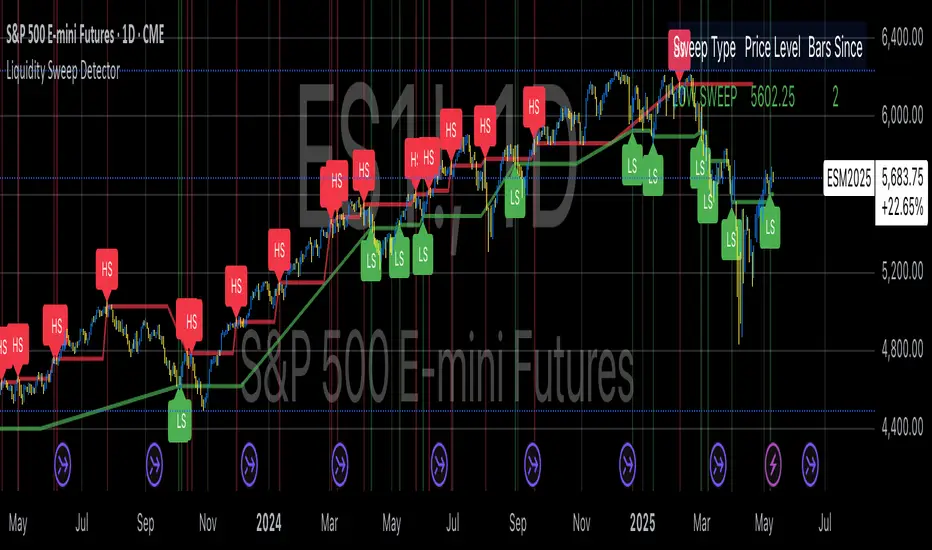
The indicator maintains historical arrays of detected sweep events with their corresponding timestamps, enabling temporal analysis of market behavior following such events. Visual elements include horizontal lines marking sweep levels, background color highlighting for sweep events, and an information table displaying active sweeps with their corresponding price levels and elapsed time since detection. This visualization approach allows traders to quickly identify potential institutional activity without requiring complex interpretation of raw price data.
Parameter customization includes adjustable lookback periods for swing point identification, sweep threshold percentages for signal sensitivity, and display duration settings. These parameters allow traders to adapt the indicator to various market conditions and timeframes, as markets demonstrate different liquidity characteristics across instruments and periods (Madhavan, 2000).
Empirical studies by Easley et al. (2012) suggest that retail traders who successfully identify and act upon institutional liquidity sweeps may achieve superior risk-adjusted returns compared to conventional technical analysis approaches. However, as cautioned by Chordia et al. (2008), such patterns should be considered within broader market context rather than in isolation, as their predictive value varies significantly with overall market volatility and liquidity conditions.
References:
Bulkowski, T. (2011). Encyclopedia of Chart Patterns (2nd ed.). John Wiley & Sons.
Chordia, T., Roll, R., & Subrahmanyam, A. (2008). Liquidity and market efficiency. Journal of Financial Economics, 87(2), 249-268.
Easley, D., López de Prado, M., & O'Hara, M. (2012). Flow Toxicity and Liquidity in a High-frequency World. The Review of Financial Studies, 25(5), 1457-1493.
Harris, L. (2003). Trading and Exchanges: Market Microstructure for Practitioners. Oxford University Press.
Lo, A. W., & MacKinlay, A. C. (2011). A Non-Random Walk Down Wall Street. Princeton University Press.
Madhavan, A. (2000). Market microstructure: A survey. Journal of Financial Markets, 3(3), 205-258.
Osler, C. L. (2003). Currency Orders and Exchange Rate Dynamics: An Explanation for the Predictive Success of Technical Analysis. Journal of Finance, 58(5), 1791-1820.
Taylor, M. P. (2005). Official Foreign Exchange Intervention as a Coordinating Signal in the Dollar-Yen Market. Pacific Economic Review, 10(1), 73-82.
Osler's (2003) research documents how stop-loss orders tend to cluster around significant price levels, creating concentrations of liquidity. Taylor (2005) argues that sophisticated institutional participants systematically exploit these liquidity clusters by inducing price movements that trigger these orders, subsequently profiting from the ensuing price reaction. The algorithmic detection of such patterns involves several key processes. First, the indicator identifies swing points—local maxima and minima—through comparison with historical price data within a definable lookback period. These swing points correspond to what Bulkowski (2011) describes as "significant pivot points" that frequently serve as liquidity zones where stop orders accumulate.
The core detection algorithm utilizes a multi-stage process to identify potential sweeps. For high sweeps, it monitors when price exceeds a previous swing high by a specified threshold percentage, followed by a bearish candle that closes below the original swing high level. Conversely, for low sweeps, it detects when price drops below a previous swing low by the threshold percentage, followed by a bullish candle closing above the original swing low. As noted by Lo and MacKinlay (2011), these price patterns often emerge when large institutional players attempt to capture liquidity before initiating significant directional moves.
The indicator maintains historical arrays of detected sweep events with their corresponding timestamps, enabling temporal analysis of market behavior following such events. Visual elements include horizontal lines marking sweep levels, background color highlighting for sweep events, and an information table displaying active sweeps with their corresponding price levels and elapsed time since detection. This visualization approach allows traders to quickly identify potential institutional activity without requiring complex interpretation of raw price data.
Parameter customization includes adjustable lookback periods for swing point identification, sweep threshold percentages for signal sensitivity, and display duration settings. These parameters allow traders to adapt the indicator to various market conditions and timeframes, as markets demonstrate different liquidity characteristics across instruments and periods (Madhavan, 2000).
Empirical studies by Easley et al. (2012) suggest that retail traders who successfully identify and act upon institutional liquidity sweeps may achieve superior risk-adjusted returns compared to conventional technical analysis approaches. However, as cautioned by Chordia et al. (2008), such patterns should be considered within broader market context rather than in isolation, as their predictive value varies significantly with overall market volatility and liquidity conditions.
References:
Bulkowski, T. (2011). Encyclopedia of Chart Patterns (2nd ed.). John Wiley & Sons.
Chordia, T., Roll, R., & Subrahmanyam, A. (2008). Liquidity and market efficiency. Journal of Financial Economics, 87(2), 249-268.
Easley, D., López de Prado, M., & O'Hara, M. (2012). Flow Toxicity and Liquidity in a High-frequency World. The Review of Financial Studies, 25(5), 1457-1493.
Harris, L. (2003). Trading and Exchanges: Market Microstructure for Practitioners. Oxford University Press.
Lo, A. W., & MacKinlay, A. C. (2011). A Non-Random Walk Down Wall Street. Princeton University Press.
Madhavan, A. (2000). Market microstructure: A survey. Journal of Financial Markets, 3(3), 205-258.
Osler, C. L. (2003). Currency Orders and Exchange Rate Dynamics: An Explanation for the Predictive Success of Technical Analysis. Journal of Finance, 58(5), 1791-1820.
Taylor, M. P. (2005). Official Foreign Exchange Intervention as a Coordinating Signal in the Dollar-Yen Market. Pacific Economic Review, 10(1), 73-82.
Script open-source
Nello spirito di TradingView, l'autore di questo script lo ha reso open source, in modo che i trader possano esaminarne e verificarne la funzionalità. Complimenti all'autore! Sebbene sia possibile utilizzarlo gratuitamente, ricordiamo che la ripubblicazione del codice è soggetta al nostro Regolamento.
Where others speculate, we systematize.
edgetools.org
edgetools.org
Declinazione di responsabilità
Le informazioni e le pubblicazioni non sono intese come, e non costituiscono, consulenza o raccomandazioni finanziarie, di investimento, di trading o di altro tipo fornite o approvate da TradingView. Per ulteriori informazioni, consultare i Termini di utilizzo.