OPEN-SOURCE SCRIPT
Aggiornato + Time Weighted Average Price
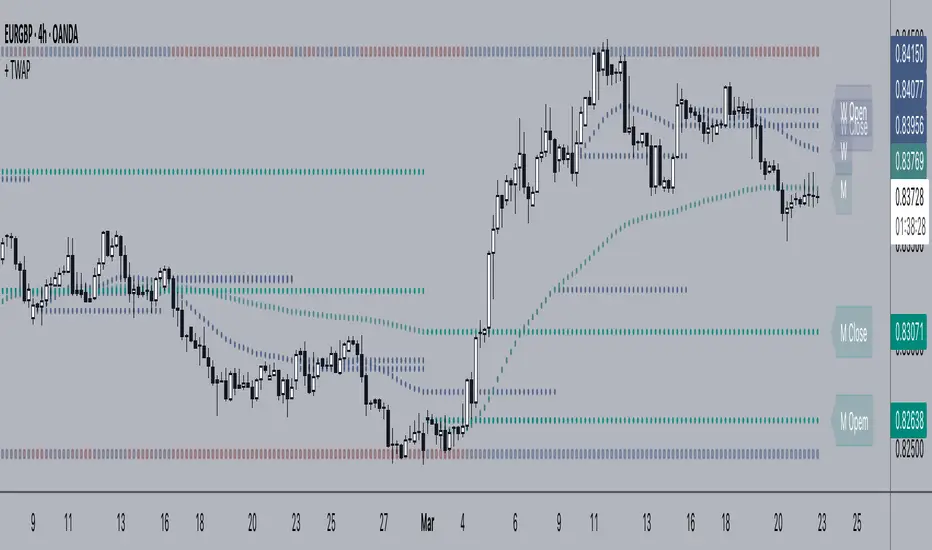
This is basically NeoButane's script (which should be more popular than it is) with a few additions, those being primarily plotted lines of the closing price of the previous TWAP, however I've also added the optionality of plotting a second TWAP of say, maybe a different resolution if you are so inclined. Also, you may plot shapes across the top or bottom of your chart color based on if current price is above or below the previous closing price of the TWAP, in case you might want to clean the chart up a bit and not plot the actual closing price lines.
But what is TWAP, exactly, you might be saying to yourself. If you're familiar with VWAP then you've probably a pretty good idea of what this is and how it works. TWAP is a calculation that defines the weighted average price over a specific time period. Traders use TWAP as a trading strategy, or more specifically, an execution strategy, to place large orders without excessively impacting the market price. They break down the large orders into several sets of small orders priced near TWAP. Basically it's VWAP but without the volume element, and most traders will likely use it in a similar fashion as they might use VWAP, and that is like a moving average--dynamic support and resistance.
I like to think of it as displaying a price range over a specified time period (such as a month or a week). This is why I think the closes of the previous period or two are so important. Losing the previous closing price or regaining it can often give you an inclination as to whether at least some of the next period (the one you're currently in) may be bearish or bullish.

Above is a more zoomed out view of ADA/USD

And here's the same image with just the closing price for the time period plotted.
Enjoy!
But what is TWAP, exactly, you might be saying to yourself. If you're familiar with VWAP then you've probably a pretty good idea of what this is and how it works. TWAP is a calculation that defines the weighted average price over a specific time period. Traders use TWAP as a trading strategy, or more specifically, an execution strategy, to place large orders without excessively impacting the market price. They break down the large orders into several sets of small orders priced near TWAP. Basically it's VWAP but without the volume element, and most traders will likely use it in a similar fashion as they might use VWAP, and that is like a moving average--dynamic support and resistance.
I like to think of it as displaying a price range over a specified time period (such as a month or a week). This is why I think the closes of the previous period or two are so important. Losing the previous closing price or regaining it can often give you an inclination as to whether at least some of the next period (the one you're currently in) may be bearish or bullish.
Above is a more zoomed out view of ADA/USD
And here's the same image with just the closing price for the time period plotted.
Enjoy!
Note di rilascio
-updated to version 5-added string inputs (dropdown boxes) for resolution selections: many from one hour to one year
-added optional labels for tWAPs and their closes
Note di rilascio
-forgot to add color inputs for labels and textNote di rilascio
- added label distance input so the labels aren't so close to the current candleNote di rilascio
- updated to pine v6- cleaned up and reduced some unnecessary code
- touched up visuals a tad
Script open-source
In pieno spirito TradingView, il creatore di questo script lo ha reso open-source, in modo che i trader possano esaminarlo e verificarne la funzionalità. Complimenti all'autore! Sebbene sia possibile utilizzarlo gratuitamente, ricorda che la ripubblicazione del codice è soggetta al nostro Regolamento.
Declinazione di responsabilità
Le informazioni ed i contenuti pubblicati non costituiscono in alcun modo una sollecitazione ad investire o ad operare nei mercati finanziari. Non sono inoltre fornite o supportate da TradingView. Maggiori dettagli nelle Condizioni d'uso.