OPEN-SOURCE SCRIPT
Aggiornato Volatility Adjusted MACD
MACD, short for moving average convergence/divergence, is a trading indicator used in technical analysis of securities prices, created by Gerald Appel in the late 1970s.[1] It is designed to reveal changes in the strength, direction, momentum, and duration of a trend in a stock's price.
The MACD indicator[2] (or "oscillator") is a collection of three time series calculated from historical price data, most often the closing price. These three series are: the MACD series proper, the "signal" or "average" series, and the "divergence" series which is the difference between the two. The MACD series is the difference between a "fast" (short period) exponential moving average (EMA), and a "slow" (longer period) EMA of the price series. The average series is an EMA of the MACD series itself.
This version of MACD follows the work of Alex Spiroglou, DipTA(ATAA), CFTe in his 2022 paper that was awarded Charles H. Dow Award by CMT Association . The paper is available on https://papers.ssrn.com/sol3/papers.cfm?abstract_id=4099617 or on website.of CMT Association.
Please refer to the paper for details on construction and trading rules . I personally find the volatility adjusted version as described in this paper more responsive in terms of signals and divergences.
Note di rilascio
MACD, short for moving average convergence/divergence, is a trading indicator used in technical analysis of securities prices, created by Gerald Appel in the late 1970s. It is designed to reveal changes in the strength, direction, momentum, and duration of a trend in a stock's price.
The MACD indicator (or "oscillator") is a collection of three time series calculated from historical price data, most often the closing price. These three series are: the MACD series proper, the "signal" or "average" series, and the "divergence" series which is the difference between the two. The MACD series is the difference between a "fast" (short period) exponential moving average (EMA), and a "slow" (longer period) EMA of the price series. The average series is an EMA of the MACD series itself.
This version of MACD follows the work of Alex Spiroglou, DipTA(ATAA), CFTe in his 2022 paper that was awarded Charles H. Dow Award by CMT Association . The paper is available on papers.ssrn.com/sol3/papers.cfm?abstract_id=4099617 or on website.of CMT Association.
Please refer to the paper for details on construction and trading rules . I personally find the volatility adjusted version as described in this paper more responsive in terms of signals and divergences.
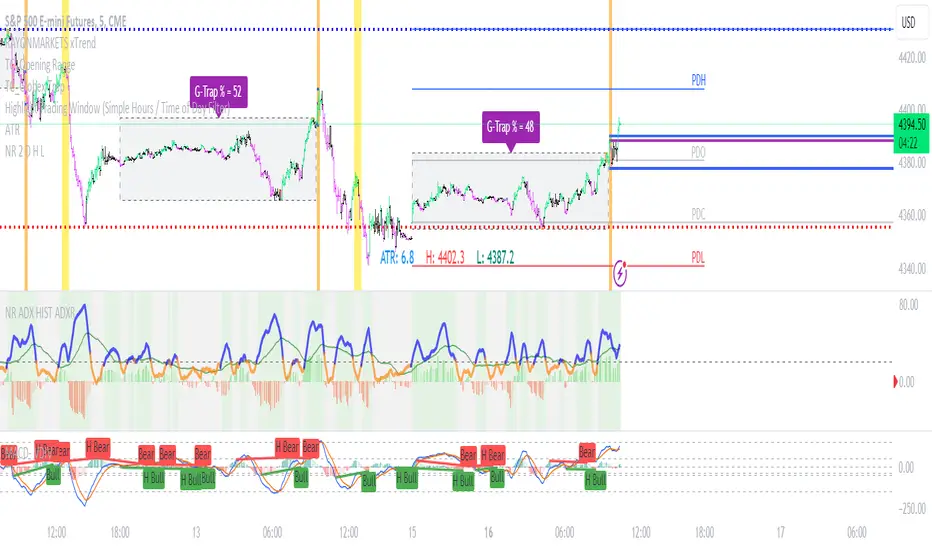
This is the updated version of my MACD- V Indicator. I have now added divergences ( both hidden and regular). Dr Alexander Elder refers to weekly MACD Divergences as one of the strongest momentum Divergence signals in his book New Trading for Living.
Also added the levels as per comment from Alex Spiroglou, author of this indicator
Script open-source
Nello spirito di TradingView, l'autore di questo script lo ha reso open source, in modo che i trader possano esaminarne e verificarne la funzionalità. Complimenti all'autore! Sebbene sia possibile utilizzarlo gratuitamente, ricordiamo che la ripubblicazione del codice è soggetta al nostro Regolamento.
RayonMarkets
Declinazione di responsabilità
Le informazioni e le pubblicazioni non sono intese come, e non costituiscono, consulenza o raccomandazioni finanziarie, di investimento, di trading o di altro tipo fornite o approvate da TradingView. Per ulteriori informazioni, consultare i Termini di utilizzo.