OPEN-SOURCE SCRIPT
Aggiornato Price Extreme Bands
Price Extreme Bands Description
This indicator calculates and displays Price Extreme Bands based on an Exponential Moving Average (EMA) and True Range Average True Range (TR ATR). It utilizes a custom "Super Smoother" function to smooth the bands, providing a clearer representation of potential price extremes without sacrificing accuracy.
Usage
Built for specifically for intraday timeframes, this indicator identifies short term price extremes and volatility ranges. Traders can observe when price moves towards the outer bands, suggesting strong momentum or potential overbought/oversold conditions. The filled zones highlight areas of increased volatility which can used as exit criteria for a trade, possible reversal points in ranging markets or price ranges where price momentum could slow in trending markets.
Key Features

Calculation:
1. EMA (Basis): Calculates the Exponential Moving Average of the selected source.
2. TR ATR: Calculates the True Range and then smoothes it using RMA (Rolling Moving Average).
3. Bands: Calculates upper and lower bands using the EMA and ATR, with multipliers of 1.71 and 2.50.
4. Super Smoother: Applies a smoothing function to the calculated bands.
Visuals:
// Note: The plot lines are invisible by default. To view the basis, upper and lower band lines, adjust the visibility settings in the indicator's settings.
Uniqueness: Ready of the box. Code and parameters built specifically for 1m to 15m timeframes provides users with an indicator to easily identify price extremes. The use of TR ATR and addition of the Super Smoother calculation create a easier visualization and implementation compared to existing price band options.
This indicator calculates and displays Price Extreme Bands based on an Exponential Moving Average (EMA) and True Range Average True Range (TR ATR). It utilizes a custom "Super Smoother" function to smooth the bands, providing a clearer representation of potential price extremes without sacrificing accuracy.
Usage
Built for specifically for intraday timeframes, this indicator identifies short term price extremes and volatility ranges. Traders can observe when price moves towards the outer bands, suggesting strong momentum or potential overbought/oversold conditions. The filled zones highlight areas of increased volatility which can used as exit criteria for a trade, possible reversal points in ranging markets or price ranges where price momentum could slow in trending markets.
Key Features
- Length Input: Controls the length of the EMA and TR ATR calculations.
- Multiplier Inputs: Uses two fixed multipliers (1.71 and 2.50) to create bands.
- Super Smoother: Applies a custom smoothing function to the bands for reduced noise.
- Fill Zones: Fills the areas between the inner and outer bands to highlight potential volatility ranges.
Calculation:
1. EMA (Basis): Calculates the Exponential Moving Average of the selected source.
2. TR ATR: Calculates the True Range and then smoothes it using RMA (Rolling Moving Average).
3. Bands: Calculates upper and lower bands using the EMA and ATR, with multipliers of 1.71 and 2.50.
4. Super Smoother: Applies a smoothing function to the calculated bands.
Visuals:
- Basis Line: Plots the EMA (basis) (invisible by default).
- Inner Bands (1.71 Multiplier): Plots the smoothed bands with a distinct color (e.g., orange) (invisible by default).
- Outer Bands (2.50 Multiplier): Plots the smoothed bands with a different color (e.g., purple) (invisible by default).
- Fill Zones: Fills the region between the inner and outer upper bands and the inner and outer lower bands with a translucent color (e.g. light blue).
// Note: The plot lines are invisible by default. To view the basis, upper and lower band lines, adjust the visibility settings in the indicator's settings.
Uniqueness: Ready of the box. Code and parameters built specifically for 1m to 15m timeframes provides users with an indicator to easily identify price extremes. The use of TR ATR and addition of the Super Smoother calculation create a easier visualization and implementation compared to existing price band options.
Note di rilascio
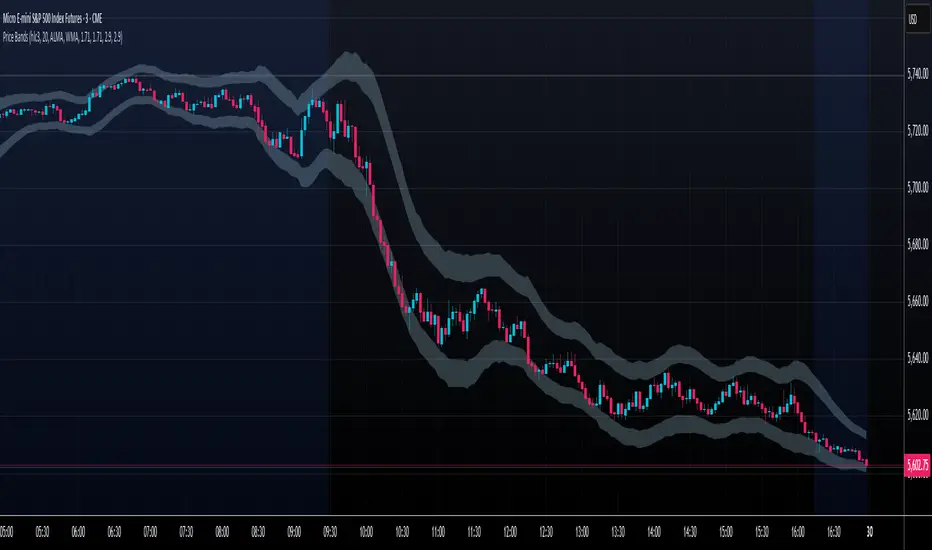
Price Extreme BandsThis highly customizable script calculates and plots price bands based on a selectable moving average and Average True Range (ATR). It's customizability comes from the ability to choose from 6 different basis line calculation and 4 different ATR types to fine tune the indicator to the user's needs.
The script includes custom code to include functions for Least Squared Moving Average (LSMA) and Kaufman's Adaptive Moving Average (KAMA).
Usage
This indicator identifies short term price extremes and volatility ranges. Traders can observe when price moves towards the outer bands, suggesting strong momentum or potential overbought/oversold conditions.
The filled zones highlight areas of increased volatility which can used as exit criteria for a trade, possible reversal points in ranging markets or price ranges where price momentum could slow in trending markets.
Key Features:
- Selectable Basis and length: Choose from ALMA (default), EMA, WMA, HMA, LSMA, SMA, or KAMA for the basis line calculation.
- Selectable ATR Type: Choose from WMA (default), SMA, EMA, or RMA for the ATR calculation.
- Customizable Multipliers: Adjust the multipliers for the upper and lower bands (default set to 1.71 and 2.90).
- Visual Clarity: Plots the basis line (optional) and fills the areas between the bands for easy identification of potential support and resistance levels.
Plots:
- Basis: Optional plot of the selected moving average.
- Upper and Lower Bands: Plots of the bands calculated using the ATR and multipliers.
- Fill: Fills the area between the 1.71 and 2.90 bands to highlight potential trading ranges.
Script open-source
Nello spirito di TradingView, l'autore di questo script lo ha reso open source, in modo che i trader possano esaminarne e verificarne la funzionalità. Complimenti all'autore! Sebbene sia possibile utilizzarlo gratuitamente, ricordiamo che la ripubblicazione del codice è soggetta al nostro Regolamento.
discord.gg/REapC6SGtz
b3artrades@gmail.com
b3artrades@gmail.com
Declinazione di responsabilità
Le informazioni e le pubblicazioni non sono intese come, e non costituiscono, consulenza o raccomandazioni finanziarie, di investimento, di trading o di altro tipo fornite o approvate da TradingView. Per ulteriori informazioni, consultare i Termini di utilizzo.