OPEN-SOURCE SCRIPT
Aggiornato Price Stats / Price Data [LevelUp]
Introduction
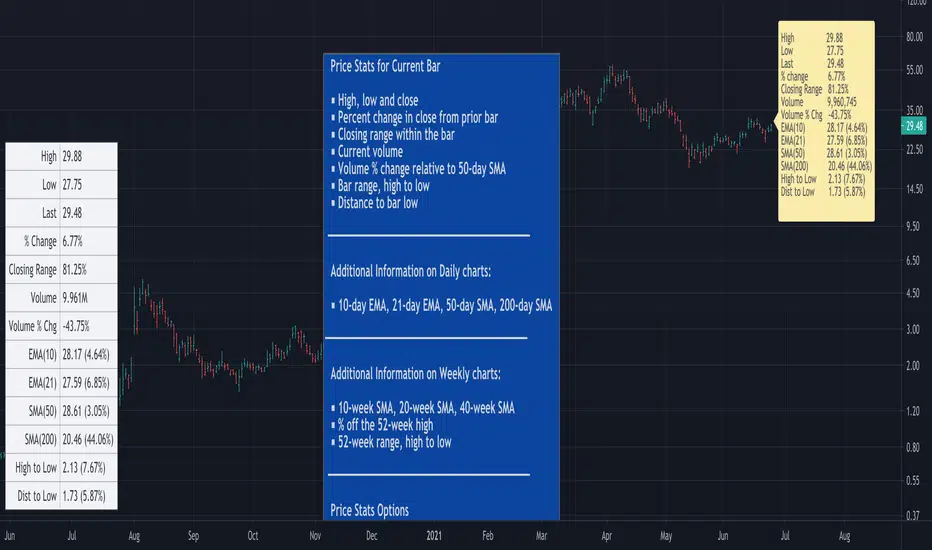
Price Stats is an indicator based on the statistics shown in MarketSmith charting software when viewing the Track Price information, also known as the "yellow box."
The following stats are available for the most recent price bar:
■ High price
■ Low price
■ Last price
■ Percent change in price from prior bar
■ Closing range within the bar
■ Current volume
■ Volume % change relative to the 50-day moving average volume
For daily charts:
■ 21-day EMA and % offset of price
■ 50-day SMA and % offset of price
■ 200-day SMA and % offset of price
Here's how to interpret the moving averages:
In the image below the 50-day SMA is 74.58 (8.04%). 74.58 represents the value of the 50-day SMA. 8.04% indicates that the current price is 8.04% above the SMA. A negative % would indicate the current price is the specified % below the SMA.
Note di rilascio
version 2.0Add support to show price stats for weekly charts:
■ 10-week SMA and % offset of price
■ 40-week SMA and % offset of price
■ Price % off the 52-week high
■ 52-week price range, high to low
Note di rilascio
version 3.0Updates:
■ Left/right offset of the Price Stats dialog can now be configured.
■ Minor changes to how the offset is calculated based on the day of the week.
Note di rilascio
version 4.0Update:
■ Choose your preferred font size for the text.
Note di rilascio
version 5.0Update:
■ Update formatting of the volume to make it easier to read.
Note di rilascio
version 6.0Update:
■ Add "Distance to Low" option
Knowing the distance to the low can help when setting a stop. For example, if buying an upside reversal, a logical stop could be set at the low of the bar. At a glance, you can now see the percentage and distance in points from the current price to the low. This allows for a quick determination if low is within your preferred stop range.
Note di rilascio
version 7.0Update:
■ Duplicate labels no longer appear when using the Bar Replay option
■ Code cleanup
Note di rilascio
version 8.0Updates:
■ Vertical and horizontal placement of the Price Stats are now configurable.
■ Add 'High to Low' which shows range in price as points and percentage.
The 'High to Low' value may be helpful if you plan to buy on a breakout to a new high. At a glance, you'll know the percentage and distance in points if you opt to use the low of the bar as a stop.
Note di rilascio
version 9.0What's new:
■ Add 20-week simple moving average to the weekly chart.
Note di rilascio
version 10.0What's New:
■ Price Stats can be shown in a table with a configurable location.
Note di rilascio
version 11.0What's New:
■ Computations that return NaN (Not a Number) will now return 0.
Note di rilascio
version 12.0What's New:
■ Minor updates to the display of 52-week highs and lows.
Script open-source
Nello spirito di TradingView, l'autore di questo script lo ha reso open source, in modo che i trader possano esaminarne e verificarne la funzionalità. Complimenti all'autore! Sebbene sia possibile utilizzarlo gratuitamente, ricordiamo che la ripubblicazione del codice è soggetta al nostro Regolamento.
Join traders in over 40 countries and LevelUp!
tradingview.com/spaces/LevelUpTools/
tradingview.com/spaces/LevelUpTools/
Declinazione di responsabilità
Le informazioni e le pubblicazioni non sono intese come, e non costituiscono, consulenza o raccomandazioni finanziarie, di investimento, di trading o di altro tipo fornite o approvate da TradingView. Per ulteriori informazioni, consultare i Termini di utilizzo.