OPEN-SOURCE SCRIPT
Aggiornato Volume Candles

Volume Candles — Context-Aware Candle Color
Description:
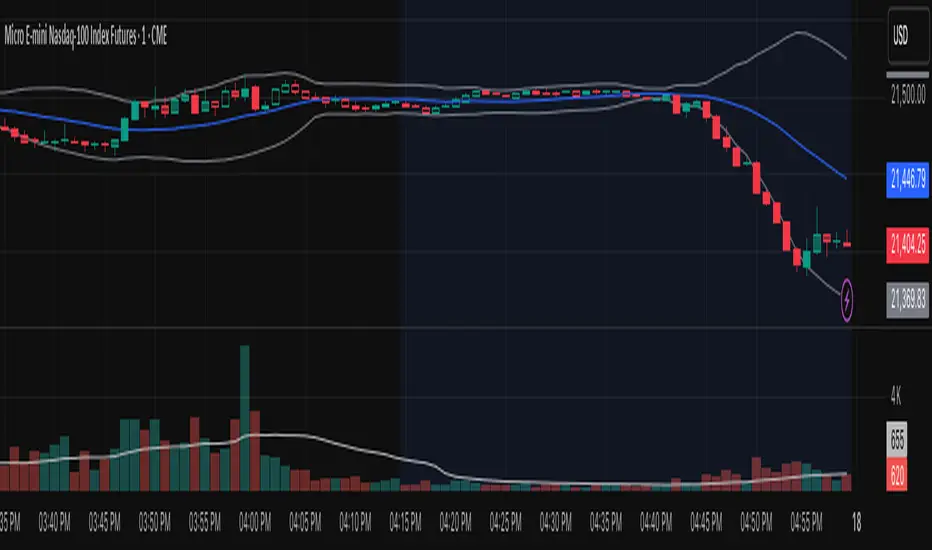
This visual indicator colors your price candles based on relative volume intensity, helping traders instantly detect low, medium, and high volume activity at a glance. It supports two modes — Percentile Ranking and Volume Average — offering flexible interpretation of volume pressure across all timeframes.
It uses a 3-tiered color system (bright, medium, dark) with customizable tones for both bullish and bearish candles.
How It Works:
You can choose between two modes for volume classification:
Ranking Mode (Default):
Measures current volume’s percentile rank over a lookback period. Higher percentiles = stronger color intensity.
Percentile thresholds:
Volume Average Mode:
Compares current volume against its simple moving average (SMA).
Volume thresholds:
Candle Paint:
Candles are colored directly on the chart, not in a separate pane. Bullish candles use green shades, bearish use red. All colors are fully customizable.
How to Interpret:
Example Use Cases:
Inputs & Settings:
Best For:
Pro Tips:
Description:
This visual indicator colors your price candles based on relative volume intensity, helping traders instantly detect low, medium, and high volume activity at a glance. It supports two modes — Percentile Ranking and Volume Average — offering flexible interpretation of volume pressure across all timeframes.
It uses a 3-tiered color system (bright, medium, dark) with customizable tones for both bullish and bearish candles.
How It Works:
You can choose between two modes for volume classification:
Ranking Mode (Default):
Measures current volume’s percentile rank over a lookback period. Higher percentiles = stronger color intensity.
Percentile thresholds:
- < 50% → light color (low volume)
- 50–80% → medium intensity
- > 80% → high volume
Volume Average Mode:
Compares current volume against its simple moving average (SMA).
Volume thresholds:
- < 0.5× SMA → light color
- Between 0.5× and 1.5× → medium
- > 1.5× → high intensity
Candle Paint:
Candles are colored directly on the chart, not in a separate pane. Bullish candles use green shades, bearish use red. All colors are fully customizable.
How to Interpret:
- Bright Colors = High volume (potential strength or climax)
- Muted/Transparent Colors = Low or average volume (consolidation, traps)
Example Use Cases:
- Spot fakeouts with large price movement on weak volume (dark color)
- Confirm breakout strength with bright candles
- Identify stealth accumulation/distribution
Inputs & Settings:
- Mode: Ranking Percentile or Volume Average
- Lookback Period for ranking and SMA
- Custom Colors for bullish and bearish candles at 3 intensity levels
Best For:
- Price action traders wanting context behind each candle
- Scalpers and intraday traders needing real-time volume feedback
- Anyone using volume as a filter for entries or breakouts
Pro Tips:
- Combine with Price Action, Bollinger Bands or VWAP/EMA levels to confirm breakout validity and intent behind a move.
- Use alongside RSI/MACD divergences for high-volume reversal signals.
- For swing trading, expand the lookback period to better normalize volume over longer trends.
Note di rilascio
Volume Candles — Context-Aware Candle ColorDescription:
This visual indicator colors your price candles based on relative volume intensity, helping traders instantly detect low, medium, and high volume activity at a glance. It supports two modes — Percentile Ranking and Volume Average — offering flexible interpretation of volume pressure across all timeframes.
It uses a 3-tiered color system (bright, medium, dark) with customizable tones for both bullish and bearish candles.
How It Works:
You can choose between two modes for volume classification:
Ranking Mode (Default):
Measures current volume’s percentile rank over a lookback period. Higher percentiles = stronger color intensity.
Percentile thresholds:
- < 50% → light color (low volume)
- 50–80% → medium intensity
- > 80% → high volume
Volume Average Mode:
Compares current volume against its simple moving average (SMA).
Volume thresholds:
- < 0.5× SMA → light color
- Between 0.5× and 1.5× → medium
- > 1.5× → high intensity
Candle Paint:
Candles are colored directly on the chart, not in a separate pane. Bullish candles use green shades, bearish use red. All colors are fully customizable.
How to Interpret:
- Bright Colors = High volume (potential strength or climax)
- Muted/Transparent Colors = Low or average volume (consolidation, traps)
Example Use Cases:
- Spot fakeouts with large price movement on weak volume (dark color)
- Confirm breakout strength with bright candles
- Identify stealth accumulation/distribution
Inputs & Settings:
- Mode: Ranking Percentile or Volume Average
- Lookback Period for ranking and SMA
- Custom Colors for bullish and bearish candles at 3 intensity levels
Best For:
- Price action traders wanting context behind each candle
- Scalpers and intraday traders needing real-time volume feedback
- Anyone using volume as a filter for entries or breakouts
Pro Tips:
- Combine with Price Action, Bollinger Bands or VWAP/EMA levels to confirm breakout validity and intent behind a move.
- Use alongside RSI/MACD divergences for high-volume reversal signals.
- For swing trading, expand the lookback period to better normalize volume over longer trends.
Script open-source
Nello spirito di TradingView, l'autore di questo script lo ha reso open source, in modo che i trader possano esaminarne e verificarne la funzionalità. Complimenti all'autore! Sebbene sia possibile utilizzarlo gratuitamente, ricordiamo che la ripubblicazione del codice è soggetta al nostro Regolamento.
Declinazione di responsabilità
Le informazioni e le pubblicazioni non sono intese come, e non costituiscono, consulenza o raccomandazioni finanziarie, di investimento, di trading o di altro tipo fornite o approvate da TradingView. Per ulteriori informazioni, consultare i Termini di utilizzo.