OPEN-SOURCE SCRIPT
Ehlers Early Onset Trend
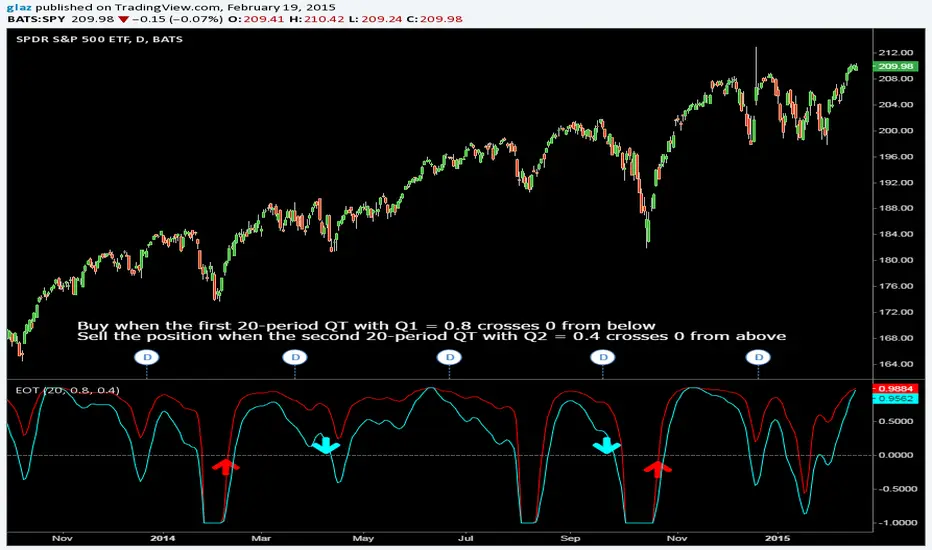
In his article in this issue, “The Quotient Transform,” author John Ehlers introduces the quotient transform (QT), a zero-lag filter that can be used for the purpose of timely trend detection. The QT is an advancement of the technique he presented in his January 2014 S&C article, “Predictive And Successful Indicators.” This time, the output of a roofing filter (which includes applying a high-pass filter and SuperSmoother filter) is normalized.
Code and other platforms traders.com/documentation/feedbk_docs/2014/08/TradersTips.html
Pinescript code Glaz and LazyBear
Code and other platforms traders.com/documentation/feedbk_docs/2014/08/TradersTips.html
Pinescript code Glaz and LazyBear
Script open-source
Nello spirito di TradingView, l'autore di questo script lo ha reso open source, in modo che i trader possano esaminarne e verificarne la funzionalità. Complimenti all'autore! Sebbene sia possibile utilizzarlo gratuitamente, ricordiamo che la ripubblicazione del codice è soggetta al nostro Regolamento.
Declinazione di responsabilità
Le informazioni e le pubblicazioni non sono intese come, e non costituiscono, consulenza o raccomandazioni finanziarie, di investimento, di trading o di altro tipo fornite o approvate da TradingView. Per ulteriori informazioni, consultare i Termini di utilizzo.