PROTECTED SOURCE SCRIPT
Trapper Absolute PriceAction
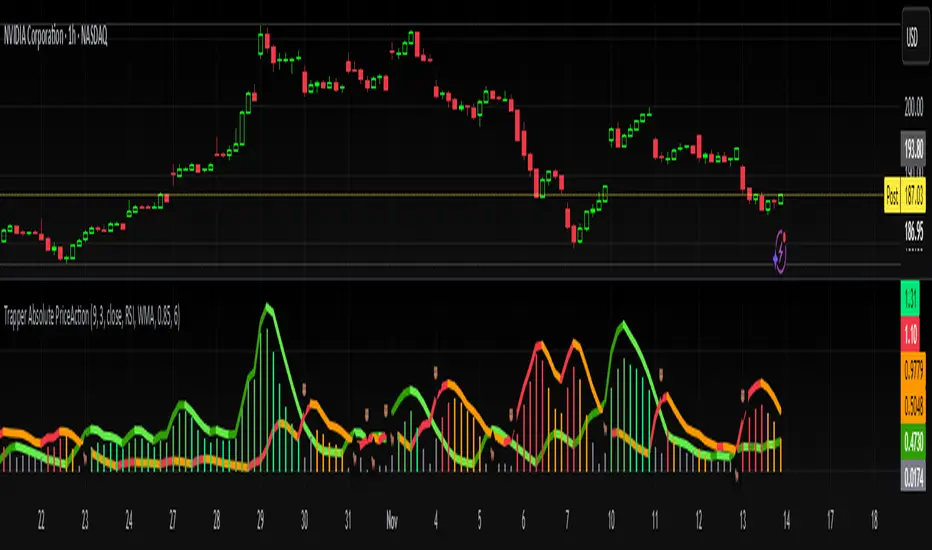
The Trapper Absolute PriceAction (TAPA) indicator is a custom, momentum-based oscillator designed to help traders visually read shifts in bullish and bearish price strength — with no reliance on volume or external data.
TAPA calculates and smooths both bullish and bearish momentum using multiple methods (RSI, Stochastic, or ADX) and compares their relative strength in real time. The result is a clean dual-line oscillator with color-coded histograms that highlight which side of the market currently has control.
It was built to give traders a sniper-level precision tool for detecting early momentum shifts before they appear clearly on price charts, allowing confirmation or invalidation of setups faster than with lagging indicators.
How It Works
Momentum Strength Calculation
The script measures directional price movement across the chosen mode (RSI, Stochastic, or ADX).
These values are smoothed twice using a selectable moving average type (WMA, EMA, SMA, ALMA, HMA, etc.).
Bullish & Bearish Curves
The green line represents smoothed bullish momentum (SmthBulls).
The orange/red line represents smoothed bearish momentum (SmthBears).
Histogram Strength Visualization
The distance between the two curves forms a color-coded histogram.
Green/Lime bars indicate growing bullish control, while Orange/Red bars show bearish dominance.
A gray neutral zone reflects indecision or range-bound conditions.
Signal Triggers
BUY 🐂 appears when the green line crosses up through the orange — signaling a bullish momentum flip.
SELL 🐻 appears when the green line crosses down through the orange — signaling bearish control.
Alerts can be enabled directly in TradingView through the BUY (🐂) or SELL (🐻) alert conditions for automated notifications or integrations.
How to Use
1. Confirm Early Momentum Shifts
When a crossover appears, check that the histogram color supports the move (green shades for bullish, red/orange for bearish).
Avoid signals when both lines are tangled and the histogram alternates gray, that usually indicates consolidation or low volatility.
2. Validate with Higher-Timeframe Structure
TAPA is most powerful when aligned with trend structure from higher timeframes.
Example: A bullish crossover on the 1-hour timeframe, while the daily TAPA shows the green line already rising, can confirm momentum alignment before entry.
3. Combine with Support/Resistance
Mark your key support and resistance zones (manual or using your “Trapper S&R PRO” indicator).
Look for a TAPA bullish crossover occurring at a major support zone, that’s often the start of a reversal move.
4. Multi-Mode Analysis
Experiment with “Indicator Method” in the inputs:
RSI Mode - smoother and responsive for swing trading.
Stochastic Mode - better for short-term entries and exits.
ADX Mode - captures trending momentum on strong breakouts.
Examples
Bullish Example:
Price forms a higher low on the chart while TAPA’s green line crosses up through orange with a lime/green histogram. That’s a strong early signal that momentum is reversing before price confirms on structure.
Bearish Example:
Price rallies into resistance, then TAPA shows a red histogram and a bearish cross (green dropping under orange). That’s typically a high-probability short signal once structure breaks.
What Makes TAPA Different
No Volume Dependency: Focuses purely on price behavior, not volume spikes or anomalies.
Multi-Mode Engine: Switch between RSI, Stochastic, or ADX-style momentum math instantly.
Customizable Visuals: Editable histogram color layers (weak/strong bull/bear, neutral) and line color control.
Sniper Labeling System: Clean, minimal BUY/SELL cues at each verified crossover.
Alert-Ready: Built-in conditions allow for TradingView alerts, webhooks, or bot automation.
Modernized Core: Rebuilt in Pine v6 with optimized performance and compliance to TradingView standards.
TAPA is designed to filter out the noise and show what truly drives a move — the shift in control between buyers and sellers.
Best Pairing Indicators
To get maximum clarity and confluence:
Trapper Support & Resistance PRO
Helps identify key zones where momentum flips from TAPA have the most impact. A bullish crossover at a defined support level often marks an early trend reversal.
Trapper Volume Trigger
While TAPA doesn’t use volume internally, pairing it with a volume-based trigger confirms that momentum shifts have institutional participation.
Simple Moving Averages (5, 20, or 50)
Overlay short and mid-term SMAs on your chart to confirm directional bias. A bullish TAPA cross that aligns with SMA-5 crossing above SMA-20 increases reliability.
Disclaimer
This indicator is provided for educational and analytical purposes only.
It does not constitute financial advice or a recommendation to buy or sell any security.
Always conduct your own due diligence and practice proper risk management before trading any strategy.
© 2025 RAMS-offthecharts | “Read • Analyze • Mark • Snipe.”
TAPA is part of the RAMS ecosystem of tactical market tools, designed for traders who focus on precision, discipline, and momentum awareness.
Script protetto
Questo script è pubblicato come codice protetto. Tuttavia, è possibile utilizzarle liberamente e senza alcuna limitazione – ulteriori informazioni qui.
#R.A.M.S
Declinazione di responsabilità
Le informazioni e le pubblicazioni non sono intese come, e non costituiscono, consulenza o raccomandazioni finanziarie, di investimento, di trading o di altro tipo fornite o approvate da TradingView. Per ulteriori informazioni, consultare i Termini di utilizzo.