PROTECTED SOURCE SCRIPT
Aggiornato Net New Highs Crossover
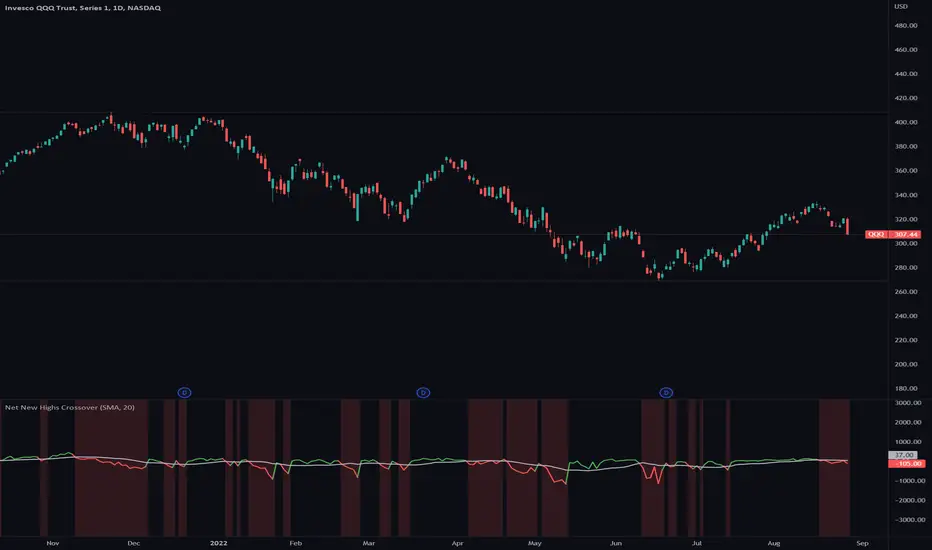
A lot of traders have a hard time to get in and out of the market at the right time.
Net New Highs of stocks can guide you to increase or decrease your exposure based on the current market health.
They are calculated by subtracting the new highs of the new lows, based on all stocks of the NYSE, NASDAQ and AMEX.
+ A positive value shows that the market is doing good, since more stocks are making new highs compared to new lows.
- A negative value shows that the market is doing bad, since more stocks are making new lows compared to new highs.
Combined with a moving average you can see crossovers that can warn you early when there is a change in the current market health.
Features
■ You can select different Net New High indices or combine them (NYSE, NASDAQ and AMEX)
■ You can specify a moving average line ( SMA / EMA and length)
■ Use single color or two colors for the moving average line to better spot the crossovers
Hints
*New highs and new lows index values currently only get updated at the end of the day
*Only works on daily timeframe
Note di rilascio
Add support for weekly and monthly timeframesNote di rilascio
Added more options to customize the stylingScript protetto
Questo script è pubblicato come codice protetto. Tuttavia, è possibile utilizzarle liberamente e senza alcuna limitazione – ulteriori informazioni qui.
Declinazione di responsabilità
Le informazioni e le pubblicazioni non sono intese come, e non costituiscono, consulenza o raccomandazioni finanziarie, di investimento, di trading o di altro tipo fornite o approvate da TradingView. Per ulteriori informazioni, consultare i Termini di utilizzo.
Script protetto
Questo script è pubblicato come codice protetto. Tuttavia, è possibile utilizzarle liberamente e senza alcuna limitazione – ulteriori informazioni qui.
Declinazione di responsabilità
Le informazioni e le pubblicazioni non sono intese come, e non costituiscono, consulenza o raccomandazioni finanziarie, di investimento, di trading o di altro tipo fornite o approvate da TradingView. Per ulteriori informazioni, consultare i Termini di utilizzo.