OPEN-SOURCE SCRIPT
Aggiornato Hybrid Trend MA
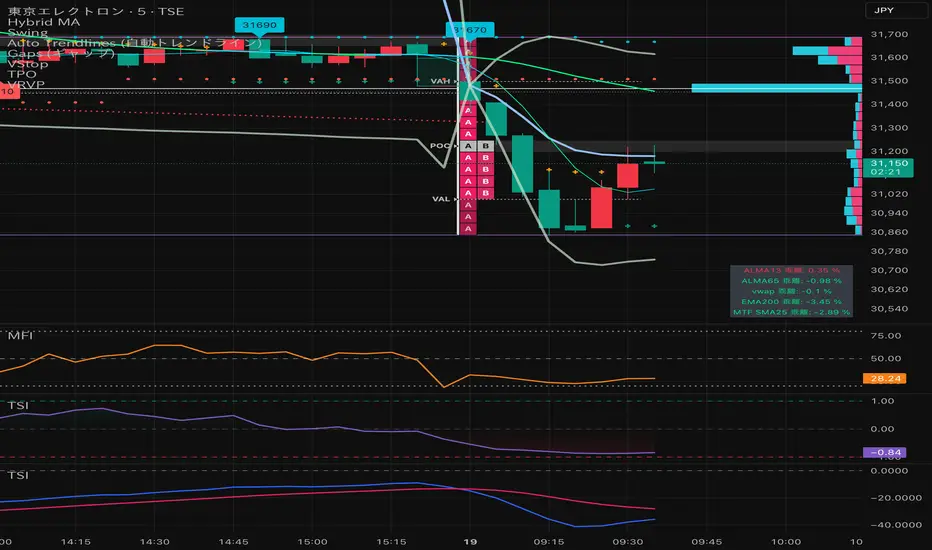
Hybrid Trend MA (Pine Script v6)
This indicator combines Exponential Moving Averages (EMA) and Arnaud Legoux Moving Averages (ALMA) into a single hybrid trend-following tool. It is designed to help traders visualize medium- and long-term trend directions while also capturing smoother short-term signals.
Key Features:
EMA Trend Structure
Three EMAs are plotted (lengths: 38, 62, 200).
Each EMA line changes color depending on whether it is rising or falling relative to the others:
Red → Strong uptrend alignment.
Lime → Strong downtrend alignment.
Aqua → Neutral or transition.
The indicator also fills the space between EMA zones with silver shading to highlight trend channels.
ALMA Trend Confirmation
Two ALMA curves are plotted (lengths: 13, 50).
Similar rising/falling logic is applied to color them:
Red → Bullish alignment and rising.
Green → Bearish alignment and falling.
Cyan → Neutral or uncertain trend.
A cross marker is plotted whenever the fast and slow ALMA lines cross, which may serve as an entry/exit confirmation.
Customizable Smoothing
The smoothe setting controls how many bars are checked to confirm whether an EMA or ALMA is rising/falling, helping reduce noise.
How to Use:
Trend Identification: The EMA set shows the larger market structure. When all EMAs align in direction and color, the trend is stronger.
Entry & Exit Confirmation: The ALMA cross signals can be used to refine entries and exits within the broader EMA trend.
Dynamic Visuals: Colored EMAs + ALMAs make it easy to distinguish bullish, bearish, and ranging conditions at a glance.
Note di rilascio
Add VWAPScript open-source
Nello spirito di TradingView, l'autore di questo script lo ha reso open source, in modo che i trader possano esaminarne e verificarne la funzionalità. Complimenti all'autore! Sebbene sia possibile utilizzarlo gratuitamente, ricordiamo che la ripubblicazione del codice è soggetta al nostro Regolamento.
Declinazione di responsabilità
Le informazioni e le pubblicazioni non sono intese come, e non costituiscono, consulenza o raccomandazioni finanziarie, di investimento, di trading o di altro tipo fornite o approvate da TradingView. Per ulteriori informazioni, consultare i Termini di utilizzo.
Script open-source
Nello spirito di TradingView, l'autore di questo script lo ha reso open source, in modo che i trader possano esaminarne e verificarne la funzionalità. Complimenti all'autore! Sebbene sia possibile utilizzarlo gratuitamente, ricordiamo che la ripubblicazione del codice è soggetta al nostro Regolamento.
Declinazione di responsabilità
Le informazioni e le pubblicazioni non sono intese come, e non costituiscono, consulenza o raccomandazioni finanziarie, di investimento, di trading o di altro tipo fornite o approvate da TradingView. Per ulteriori informazioni, consultare i Termini di utilizzo.