Elliott Wave - Stocks
Based on my Elliott Wave - Oscillator, this signals are converted into numbers displayed on chart:
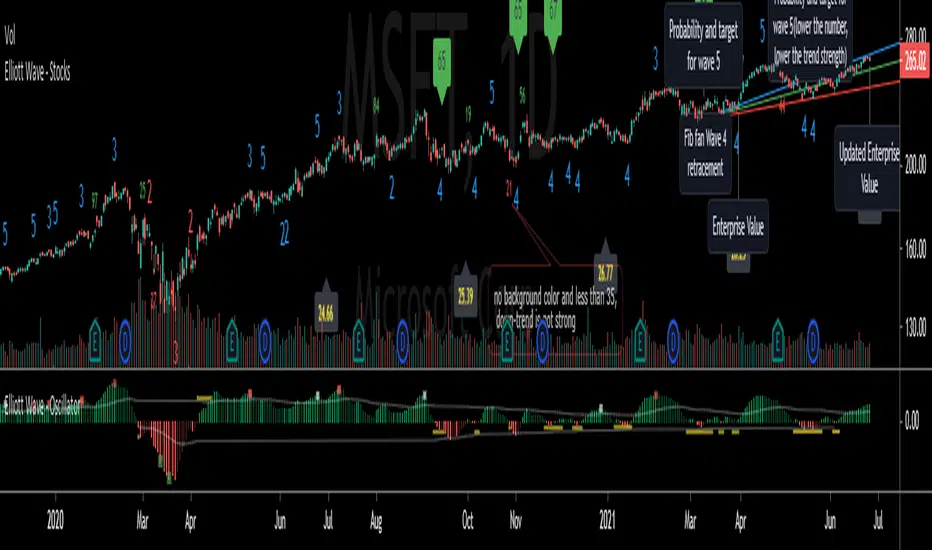
Waves2, Waves3, Waves4, Waves5:
- Indicated on Chart with numbers
Fib fan Wave 4 retracement
- Blue, green and red lines for optimum retracement
Probability and target for wave 5
- Plotted when wave 4 is found
- Stays visible in chart
- Target is based on Monthly Fibonnacci
- Probability: If current trend volume is bigger than previous opposite wave trend volume, probability is painted with color of trend background(for a trend to continue, value is recommended bigger than 35)
Projection Wave 4 (if wave 3 detected) and Projection Wave 5(if wave 4 detected)
- Only displayed when waves are active, else not displayed and not saved on chart
- For upside trend 2 blue target lines are displayed based on Monthly Fibonnacci
- For downside trend 2 red target lines are displayed based on Monthly Fibonnacci
Fundamentals: Enterprise Value
- Displayed when financial reports are updated to database
- Also displayed the latest calculated enterprise value with current stock price and last financial report
REMINDER OF OSCILATOR USE:
Waves3: Indicated in RED Line(Upwards) and Green Line(Downwards)
- Detects wave greater than SMA
Waves4: Maximum height indicated in yellow Line
- Detects when wave greater than SMA (Wave 3 or 5) approaches wave 4 regression point
Waves5: Indicated in White Line
- Detects divergence in oscilator and price, meaning end of trend
Appreciate any suggestions, collaboration, comments or ideas.
- Detects Waves 2, 3 , 4 and 5
*Fib fan Wave 4 retracement
*Probability and target for wave 5
*Projection Wave 4 (if wave 3 detected)
*Projection Wave 5(if wave 4 detected)
*Alerts for Waves 2, 3, 4 and 5
*Fundamentals: Enterprise Value
*Better and accurate targets for waves based on Stocks
- Much less graph noise overall
Fundamentals: Enterprise Value
- Calculated based on actual and historical financial data
- Gives a projection at where stock should be
- If stock is in its range, triangles are diplayed
- If stock is not in range, displays the projection
Script su invito
Solo gli utenti approvati dall'autore possono accedere a questo script. È necessario richiedere e ottenere l'autorizzazione per utilizzarlo. Tale autorizzazione viene solitamente concessa dopo il pagamento. Per ulteriori dettagli, seguire le istruzioni dell'autore riportate di seguito o contattare direttamente edgartrader1396.
TradingView NON consiglia di acquistare o utilizzare uno script a meno che non si abbia piena fiducia nel suo autore e se ne comprenda il funzionamento. È inoltre possibile trovare alternative gratuite e open source nei nostri script della community.
Istruzioni dell'autore
Declinazione di responsabilità
Script su invito
Solo gli utenti approvati dall'autore possono accedere a questo script. È necessario richiedere e ottenere l'autorizzazione per utilizzarlo. Tale autorizzazione viene solitamente concessa dopo il pagamento. Per ulteriori dettagli, seguire le istruzioni dell'autore riportate di seguito o contattare direttamente edgartrader1396.
TradingView NON consiglia di acquistare o utilizzare uno script a meno che non si abbia piena fiducia nel suo autore e se ne comprenda il funzionamento. È inoltre possibile trovare alternative gratuite e open source nei nostri script della community.