PROTECTED SOURCE SCRIPT
Z-Score Indicator
What it does:
Key Features:
Reference Lines:
How to use it:
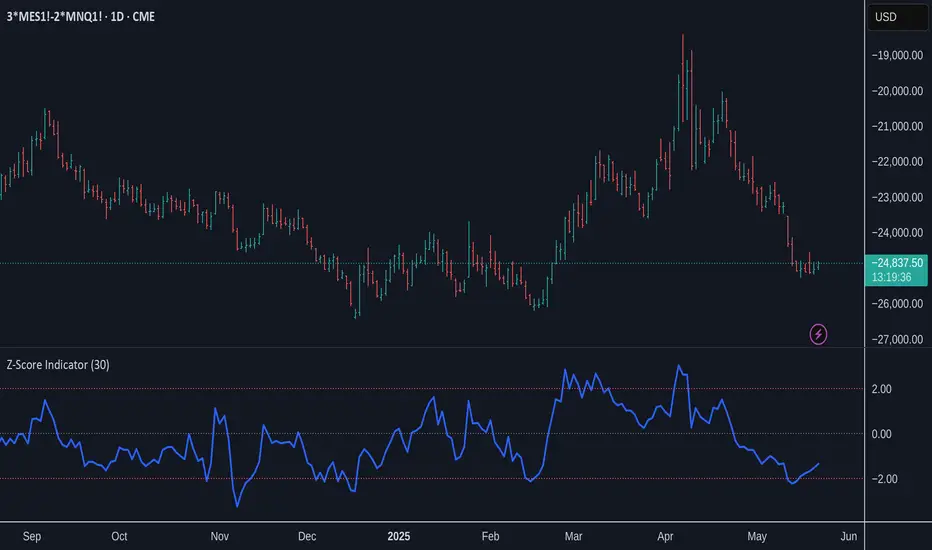
- Calculates the Z-Score: (Current Price - Average Price) / Standard Deviation
- Plots the Z-Score in a separate panel below your main chart.
- Allows you to customize the Lookback Period (default is 30 bars) to suit your trading style and the asset's characteristics. A shorter period is more sensitive, while a longer period provides a smoother output.
Key Features:
- Clear Z-Score Line: Visualizes the current Z-Score value.
Reference Lines:
- Zero Line (Gray, Dotted): Indicates the price is at its average for the lookback period.
- +2 Standard Deviations (Red, Dotted): Highlights when the price is significantly above its recent average. Often interpreted as potentially overbought.
- -2 Standard Deviations (Red, Dotted): Highlights when the price is significantly below its recent average. Often interpreted as potentially oversold.
How to use it:
- Look for Z-Score values moving towards or beyond the +2 or -2 standard deviation lines. These extremes can signal that the price has moved unusually far from its mean and might be due for a reversion or a pause.
- Use it in conjunction with other indicators and your overall market analysis to make more informed trading decisions.
- Experiment with the "Lookback Period" setting to find what works best for different assets and timeframes.
Script protetto
Questo script è pubblicato come codice protetto. Tuttavia, è possibile utilizzarle liberamente e senza alcuna limitazione – ulteriori informazioni qui.
Declinazione di responsabilità
Le informazioni e le pubblicazioni non sono intese come, e non costituiscono, consulenza o raccomandazioni finanziarie, di investimento, di trading o di altro tipo fornite o approvate da TradingView. Per ulteriori informazioni, consultare i Termini di utilizzo.