OPEN-SOURCE SCRIPT
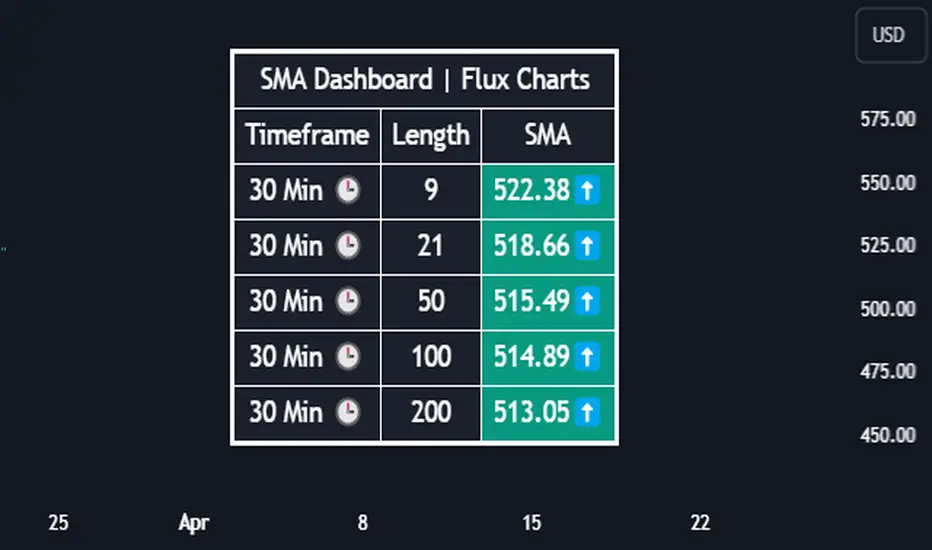
SMA Dashboard | Flux Charts
💎 GENERAL OVERVIEW
Introducing our new Simple Moving Average (SMA) Dashboard! This dashboard let's you select a source for the calculation of the SMA of it, then shows it across 5 different lengths and timeframes.

Features of the new SMA Dashboard :
📌 HOW DOES IT WORK ?
SMA is a widely used indicatior within trading community, it simply works by taking the mathematical average of a source by desired length. This indicator then shows it across 5 different timeframes in a dashboard and plots them in your chart for ease of use.

🚩UNIQUENESS
This dashboard cuts through the hassle of manual SMA calculations and plotting. It offers flexibility by allowing various data sources (even custom indicators) and customization through enabling / disabling SMA lines. The clear visualization lets you compare multiple SMAs efficiently.
⚙️SETTINGS
1. Timeframes
You can set up to 5 timeframes & lengths for the dashboard to show here. You can also turn on plotting and enable / disable them.
2. General Configuration
SMA Source -> You can select the source for the calculation of the SMA here. You can select sources from other indicators as well as more general sources like close, high and low price.
Introducing our new Simple Moving Average (SMA) Dashboard! This dashboard let's you select a source for the calculation of the SMA of it, then shows it across 5 different lengths and timeframes.
Features of the new SMA Dashboard :
- Shows SMA Across 5 Different Lengths & Timeframes.
- Select Any Source, Including Other Indicators.
- Enable / Disable Plotting Lines.
- Customizable Dashboard.
📌 HOW DOES IT WORK ?
SMA is a widely used indicatior within trading community, it simply works by taking the mathematical average of a source by desired length. This indicator then shows it across 5 different timeframes in a dashboard and plots them in your chart for ease of use.
🚩UNIQUENESS
This dashboard cuts through the hassle of manual SMA calculations and plotting. It offers flexibility by allowing various data sources (even custom indicators) and customization through enabling / disabling SMA lines. The clear visualization lets you compare multiple SMAs efficiently.
⚙️SETTINGS
1. Timeframes
You can set up to 5 timeframes & lengths for the dashboard to show here. You can also turn on plotting and enable / disable them.
2. General Configuration
SMA Source -> You can select the source for the calculation of the SMA here. You can select sources from other indicators as well as more general sources like close, high and low price.
Script open-source
Nello spirito di TradingView, l'autore di questo script lo ha reso open source, in modo che i trader possano esaminarne e verificarne la funzionalità. Complimenti all'autore! Sebbene sia possibile utilizzarlo gratuitamente, ricordiamo che la ripubblicazione del codice è soggetta al nostro Regolamento.
Access Flux Charts' exclusive indicators: fluxcharts.com/
Join our Discord community: discord.gg/FluxCharts
Join our Discord community: discord.gg/FluxCharts
Declinazione di responsabilità
Le informazioni e le pubblicazioni non sono intese come, e non costituiscono, consulenza o raccomandazioni finanziarie, di investimento, di trading o di altro tipo fornite o approvate da TradingView. Per ulteriori informazioni, consultare i Termini di utilizzo.