PROTECTED SOURCE SCRIPT
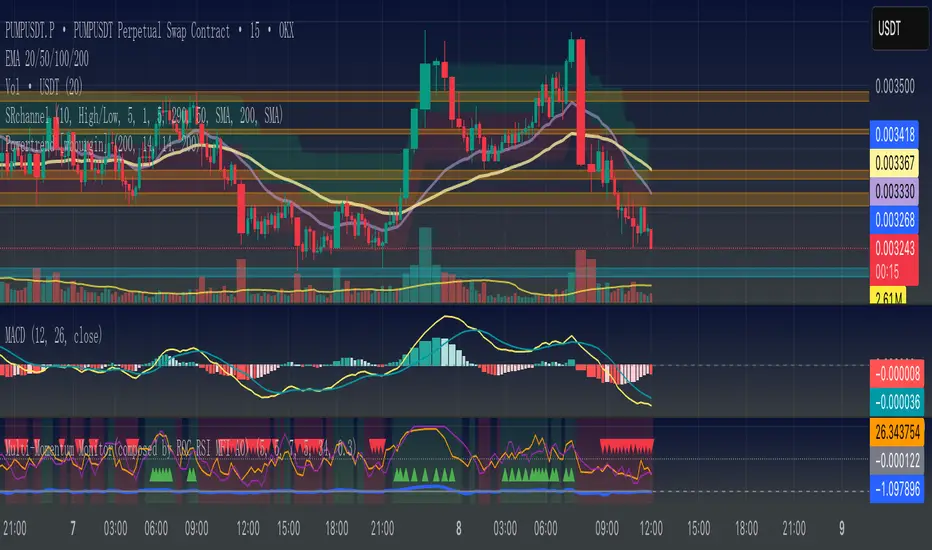
Multi-Momentum Monitor(composed by ROC RSI MFI AO)
Multi-Momentum Monitor (Multi-Momentum Monitor) instructions for use
Version: v6 revised version
Applicable objects: currency circle, stock market, futures short-term/swing trader
effect:
Integrate ROC (momentum rate of change), RSI (relative strength), MFI (capital flow), and AO (oscillator) together
Judge the direction and intensity of the current market momentum through “multi-index resonance”
Low latency, easy to configure, suitable for market tracking to assist in judging “pullback vs reversal”
1、Overview of indicator functions
Legend description:
Background color: Green = Strong kinetic energy of multiple parties (≥3/4 of the indicators are in the same direction), red = strong kinetic energy of the empty party (≤1/4 of the indicators are in the same direction)
Triangle mark: The green triangle at the bottom = all long signals of the 4/4 indicator; the red triangle at the top = all short signals of the 4/4 indicator
Four curves:
Blue = ROC (%)
Orange = RSI
Purple = MFI
Gray = AO
2、Explanation of the four core indicators (simple and easy-to-understand version)
Key points of interpretation of the role of indicators
The ROC price momentum rate of change reflects the speed of price rise/fall. ROC is greater than the threshold = long acceleration, less than the-threshold = short acceleration
RSI relative strength index RSI > 50 is too much, RSI <50 is empty
The MFI capital flow indicator combines transaction volume and price. MFI>50 indicates the net inflow of funds, and <50 indicates the net outflow of funds.
AO Super Oscillator fast line average price-slow line average price, greater than 0 is too much, less than 0 is too short
3、Parameter configuration guide
Explanation of common parameters:
ROC cycle /threshold: ROC calculation cycle and kinetic energy sensitivity. Short cycle + low threshold = sensitive (but noisy)
RSI cycle: the shorter the more sensitive, the longer the more stable
MFI cycle: it is recommended to be close to the RSI cycle
AO fast/slow cycle: commonly used 5/34, 5/21 is also available
Background color resonance judgment: ≥3 indicators in the same direction, time scale background
4、How to read the signal
Background color signal (distinguish between trend strength and weakness)
Green background: at least 3 indicators, long positions → multi-party dominance
Red background: At least 3 indicators, bears → bears dominate
No background: the kinetic energy is chaotic, and the probability of shock is large
Triangle mark (extremely strong signal)
Green triangle at the bottom: 4/4 multi-head → super multi-party kinetic energy
Red triangle at the top: 4/4 bears → Super empty kinetic energy
5、Actual usage cases
Short-term breakthrough trading
Observe the picture for 15 minutes, when the background turns green + a green triangle mark appears
There is no obvious empty signal at the upper level (1H)
Follow up at the breaking point and put the stop loss at the lowest
Distinction between callback and reversal
Pullback: The price has fallen but the background is still green, and many indicators have not all turned over.
Reversal: The price drops and the background turns red, and a red triangle appears at the same time
6、Precautions
The signal is not 100% accurate, it must be combined with multiple factors such as price structure, support and resistance.
⏳ Stronger resonance at different cycle levels (such as 15min warning + 1H confirmation)
⚠ The misjudgment rate of the volatile market is high, it is recommended to filter it in combination with the trend direction
Indicators are only an aid, not a substitute, please cooperate with your personal strategy and risk control
📊 多动能监控器(Multi-Momentum Monitor)使用说明
版本:v6 修正版
适用对象:币圈、股市、期货短线/波段交易者
作用:
把 ROC(动量变化率)、RSI(相对强弱)、MFI(资金流量)、AO(震荡指标)整合在一起
通过“多指标共振”判断当前市场动能的方向和强度
低延迟、易配置,适合盯盘辅助判断“回调 vs 反转”
0️⃣ 指标核心组成
ROC 动能速度 衡量价格变化速度,反应趋势衰竭最直接 周期(默认 5)
RSI 短周期 衡量上涨动能比例 周期(默认 5)+ 阈值(50)
MFI 短周期 加入成交量权重的 RSI 周期(默认 7)+ 阈值(50)
AO 方向强弱 快速可视化趋势动能方向 快线周期(默认 5)、慢线周期(默认 34)
1️⃣ 指标功能概览
图例说明:
背景色:绿色 = 多方动能强(≥3/4指标同向),红色 = 空方动能强(≤1/4指标同向)
三角标记:底部绿色三角 = 4/4指标全部多头信号;顶部红色三角 = 4/4指标全部空头信号
四条曲线:
蓝色 = ROC (%)
橙色 = RSI
紫色 = MFI
灰色 = AO
2️⃣ 四大核心指标解释(简单易懂版)
指标 作用 解读关键点
ROC 价格动量变化率 反映价格上涨/下跌的速度,ROC大于阈值=多头加速,小于-阈值=空头加速
RSI 相对强弱指标 RSI > 50 偏多,RSI < 50 偏空
MFI 资金流量指标 结合成交量和价格,MFI > 50 表示资金净流入,< 50 表示资金净流出
AO 超级震荡指标 快线均价 - 慢线均价,大于0偏多,小于0偏空
3️⃣ 参数配置指南
常用参数解释:
ROC 周期 / 阈值:ROC计算周期和动能敏感度。短周期 + 低阈值 = 灵敏(但噪音多)
RSI 周期:越短越敏感,越长越稳
MFI 周期:建议与RSI周期接近
AO快/慢周期:常用5/34,也可5/21
背景色共振判断:≥3个指标同方向时标背景
4️⃣ 如何读信号
📌 背景色信号(趋势强弱区分)
绿色背景:至少3个指标多头 → 多方主导
红色背景:至少3个指标空头 → 空方主导
无背景:动能混乱,震荡概率大
📌 三角标记(极强信号)
底部绿色三角:4/4 多头 → 超强多方动能
顶部红色三角:4/4 空头 → 超强空方动能
5️⃣ 实战用法案例
短线突破交易
观察15分钟图,当背景转绿 + 出现绿色三角标记
上级别(1H)无明显空方信号
在突破点跟进,止损放在前低
回调与反转区分
回调:价格回落但背景仍为绿色,多指标未全部翻空
反转:价格回落并背景翻红,同时出现红色三角
6️⃣ 注意事项
📉 信号不是100%准确,要结合价格结构、支撑阻力等多因素
⏳ 不同周期级别共振更强(如15min预警 + 1H确认)
⚠ 震荡市误判率高,建议结合趋势方向过滤
💡 指标只是辅助,不是替代品,请配合个人策略与风险控制
Script protetto
Questo script è pubblicato come codice protetto. Tuttavia, è possibile utilizzarle liberamente e senza alcuna limitazione – ulteriori informazioni qui.
Declinazione di responsabilità
Le informazioni e le pubblicazioni non sono intese come, e non costituiscono, consulenza o raccomandazioni finanziarie, di investimento, di trading o di altro tipo fornite o approvate da TradingView. Per ulteriori informazioni, consultare i Termini di utilizzo.