OPEN-SOURCE SCRIPT
25 Day and 125 Day EMA Trend Indicator
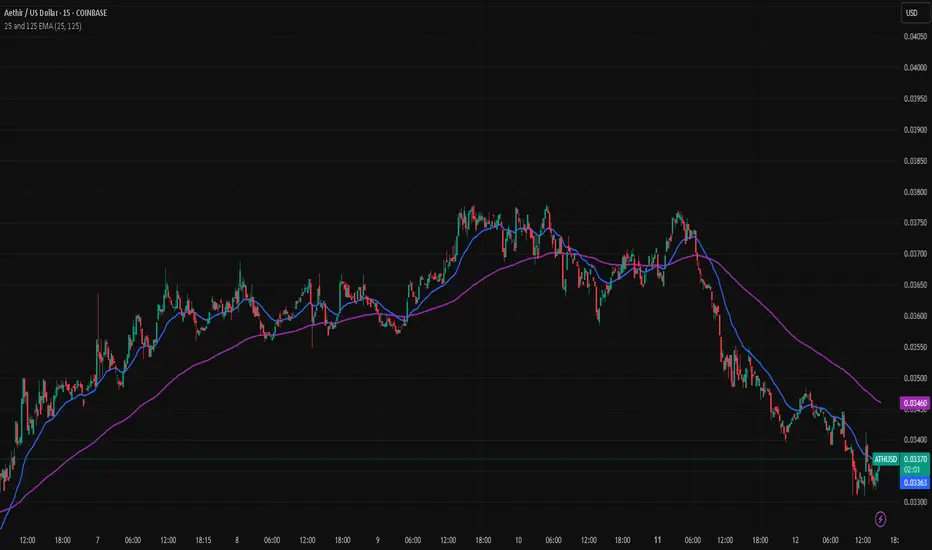
The "25 and 125 EMA Trend indicator," is a powerful yet simple tool designed for use on any TradingView chart. Its primary purpose is to help traders visually identify both short-term and long-term trends in the market.
How the Script Works
The script is built around two Exponential Moving Averages (EMAs), which are a type of moving average that gives more weight to recent price data. This makes them more responsive to current market changes than a Simple Moving Average (SMA). The two EMAs are:
Trading Signals and Interpretation
The real value of this script comes from observing the relationship between the two EMA lines.
Customisation
The script includes user-friendly input fields that allow you to customise the lengths of both EMAs directly from the indicator's settings on the chart. This lets you experiment with different time frames and tailor the indicator to your specific trading strategy.
How the Script Works
The script is built around two Exponential Moving Averages (EMAs), which are a type of moving average that gives more weight to recent price data. This makes them more responsive to current market changes than a Simple Moving Average (SMA). The two EMAs are:
- Fast EMA (25-day): Represented by the blue line, this EMA reacts quickly to price fluctuations. It's excellent for identifying the current short-term direction and momentum of the asset.
- Slow EMA (125-day): Represented by the purple line, this EMA smooths out price action over a much longer period. It's used to determine the underlying, long-term trend of the market.
Trading Signals and Interpretation
The real value of this script comes from observing the relationship between the two EMA lines.
- Uptrend: When the blue (25-day) EMA is above the purple (125-day) EMA, it indicates that the short-term trend is stronger than the long-term trend, signaling a bullish or upward-moving market.
- Downtrend: Conversely, when the blue EMA is below the purple EMA, it suggests that the short-term trend is weaker, indicating a bearish or downward-moving market.
- Cross-overs: The most important signals are often generated when the two lines cross.
- A bullish cross (or "golden cross") occurs when the blue EMA crosses above the purple EMA. This can be a signal that a new, strong uptrend is beginning.
- A bearish cross (or "death cross") occurs when the blue EMA crosses below the purple EMA. This may signal the start of a new downtrend.
Customisation
The script includes user-friendly input fields that allow you to customise the lengths of both EMAs directly from the indicator's settings on the chart. This lets you experiment with different time frames and tailor the indicator to your specific trading strategy.
Script open-source
Nello spirito di TradingView, l'autore di questo script lo ha reso open source, in modo che i trader possano esaminarne e verificarne la funzionalità. Complimenti all'autore! Sebbene sia possibile utilizzarlo gratuitamente, ricordiamo che la ripubblicazione del codice è soggetta al nostro Regolamento.
Declinazione di responsabilità
Le informazioni e le pubblicazioni non sono intese come, e non costituiscono, consulenza o raccomandazioni finanziarie, di investimento, di trading o di altro tipo fornite o approvate da TradingView. Per ulteriori informazioni, consultare i Termini di utilizzo.