OPEN-SOURCE SCRIPT
Aggiornato Draw swing Lines based on SMA
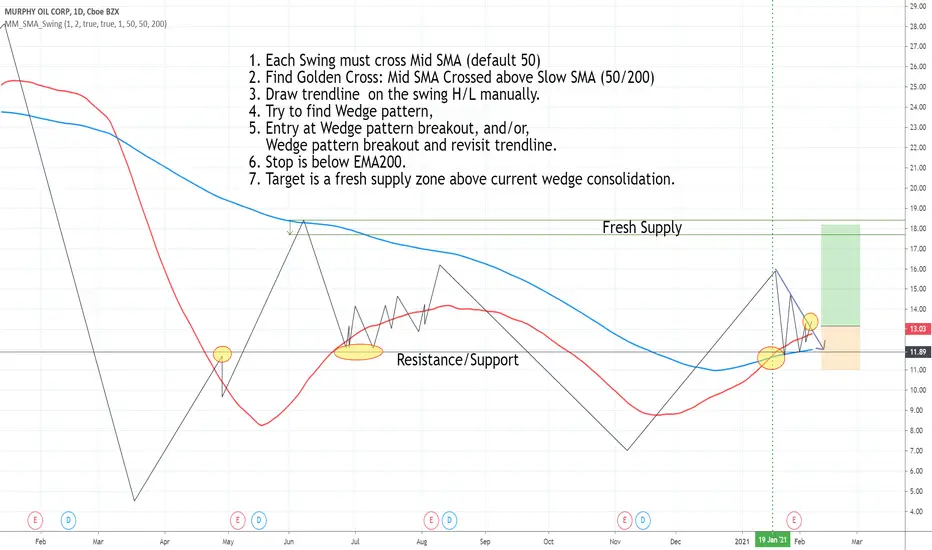
// Draw swing Lines based on SMA
// Each swing line must cross SMA
// ---------------------------------------------------
// Input:
// sma(Number): Default 50;
// showSMA: Default 'true'; if showSMA ='false', do not show SMA line;
// Deviation(%): Default "1"; To draw a new swing line, Price must cross SMA more than (n% of SMA)
// In weekly chart, better use "2" or more to avoid small ZigZag;
// ---------------------------------------------------
// This swing Lines could be used:
// 1. Verify reversal pattern, such as, double tops;
// 2. Help to draw accurate trend line, avoid noice; Set showSMA=false, to see trend line clearly;
// 3. Use two of this study together with different SMA, Set showSMA=false,
// Such as, SMA20 and SMA200, to see small waves in bigger wave
// ---------------------------------------------------
// In this sample Chart -- AMD 1h (Feb to Jun 2020)
// Added this study with SMA(50),
// Hide price chart and SMA line, to show the Swing line only,
// I drew some sample trend lines, and identified one Double top;
Note di rilascio
Add SMA 200 to help verify trend. when SMA50>SMA200, it is uptrend.Note di rilascio
Add SMA200 to show SMA50/200 relation for trend direction. Note di rilascio
Add SMA200, To find Golden cross for long entry.Script open-source
Nello spirito di TradingView, l'autore di questo script lo ha reso open source, in modo che i trader possano esaminarne e verificarne la funzionalità. Complimenti all'autore! Sebbene sia possibile utilizzarlo gratuitamente, ricordiamo che la ripubblicazione del codice è soggetta al nostro Regolamento.
Declinazione di responsabilità
Le informazioni e le pubblicazioni non sono intese come, e non costituiscono, consulenza o raccomandazioni finanziarie, di investimento, di trading o di altro tipo fornite o approvate da TradingView. Per ulteriori informazioni, consultare i Termini di utilizzo.
Script open-source
Nello spirito di TradingView, l'autore di questo script lo ha reso open source, in modo che i trader possano esaminarne e verificarne la funzionalità. Complimenti all'autore! Sebbene sia possibile utilizzarlo gratuitamente, ricordiamo che la ripubblicazione del codice è soggetta al nostro Regolamento.
Declinazione di responsabilità
Le informazioni e le pubblicazioni non sono intese come, e non costituiscono, consulenza o raccomandazioni finanziarie, di investimento, di trading o di altro tipo fornite o approvate da TradingView. Per ulteriori informazioni, consultare i Termini di utilizzo.